Paper Overview
In this tutorial, we will demonstrate how to leverage single-cell RNA-seq towards the characterization of a novel neural subset using the no-code Latch interface: Pollock. Specifically, we will do a deep dive into Olah et. al, a Nature Communications study published in 2020, which elucidated a previously uncharacterized microglial subset associated with Alzheimer’s disease. Olah et. al obtained brain tissue samples from patient neurosurgeries and autopsies, then generated scRNA-seq data from the samples. Using Louvain clustering, the group identified 14 transcriptionally distinct cell communities. Based on differential expression analysis, 9 clusters were identified as microglia - a signal that would have been lost in a bulk RNA-seq assay. Amidst these clusters, Olah et. al demonstrated that cluster 7 was particularly high in certain gene expression patterns that are known to be associated with Alzheimer’s disease. We recapitulate this examination of cluster 7 using built-in features of Pollock on Latch, without any code. To add this dataset to your Latch account, please download the .h5ad file from here. To view the associated publication, click here.Tutorial Overview
After finishing this tutorial, you should be able to:- Open a Pollock session to visualize a processed .h5ad file with a single click
- Run dimensionality reduction and clustering analyses to identify transcriptionally distinct clusters of single-cells within a larger sample
- Run differential expression to distinguish cell types via potential functional marker genes
- Select cell populations of interest, and run the sub-clustering function to generate a new count matrix
- Manually create annotations to intuitively examine subpopulations of interest, either by further sub-clustering or exploring differentially expressed gene networks
Part 1: Spinning up a Visualization Interface Using Pods
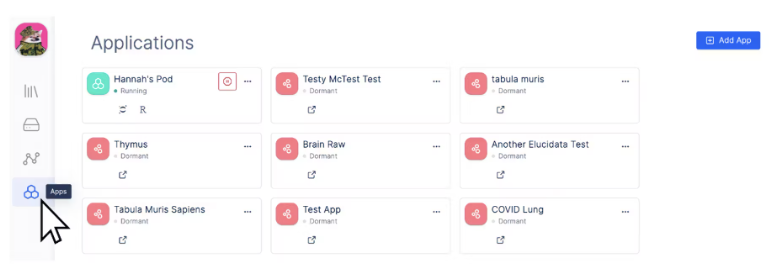
- First, navigate to the Latch sidebar and open the “Apps” tab
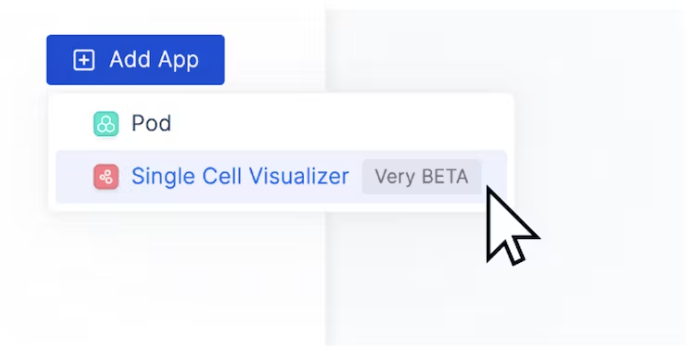
- Then, navigate to the top right corner of the dashboard and click “Add App” > “Single Cell Visualizer”
- In the “Create New Single Cell Visualizer” Page, select the H5AD file from your Latch data…..
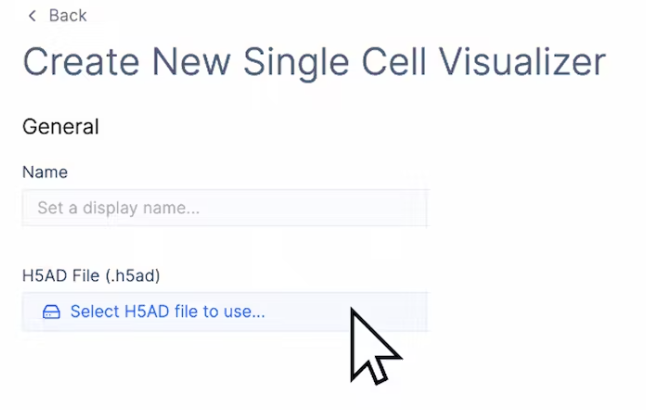
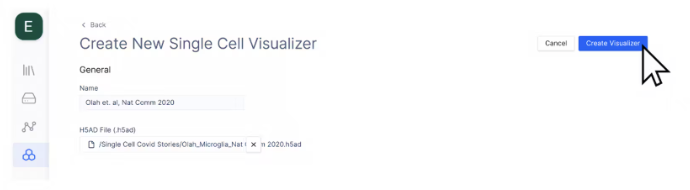
- Then give the session a Name, and navigate to the top right and click “Create Visualizer”.
- Depending on file size, it may take a few minutes for the visualizer to launch.

- Voila! Your scRNA-seq data is now ready to interact with in Pollock.
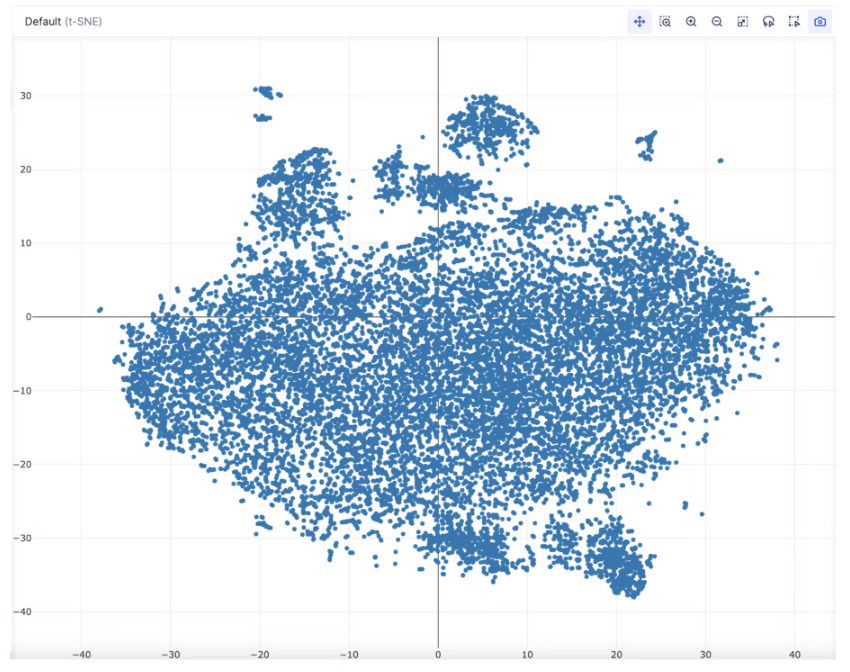
Part 2: Run First-Pass Analysis on Single Cell Data: Dimensionality Reduction (tSNE) for Visualization and Louvain Community Detection
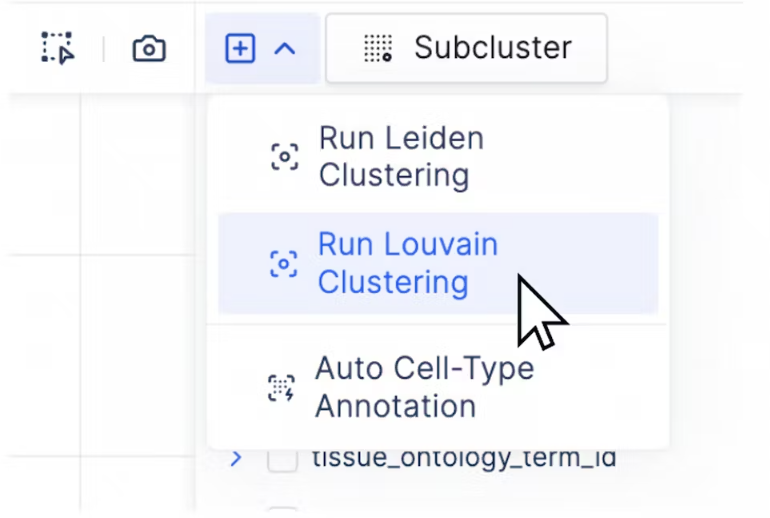
Isolating microglia from the whole sample for further analysis- Navigate to the top right corner of the Pollock interface to run Louvain clustering and detect cell communities using the built-in function on Pollock.
- On the right hand dashboard, a “louvain” annotation group will appear
- Select all Louvain clusters, or specific clusters of interest to continue viewing in Pollock, overlaid over tSNE or UMAP embedding.
Part 3: Running Differential Expression to Identify Cluster-Specific Expression Patterns
We aim to recapitulate Figure 2b from Olah et. al, where the authors annotate the different microglia subsets revealed by Louvain clustering. The authors identify several transcriptionally distinct subsets within the microglial family, with proposed markers for functional identification of each subset as visualized below: PTPRC - lineage marker for immune and myeloid cell lineages ISG15 - interferon signaling and white matter marker CD83 - marker associated with mature dendritic cells (APCs) CD74 - marked upregulation on antigen presentation/processing- CD74hi marks a subset that Olah et. al hereafter refer to as cluster 7, which contains CD74 expression levels 2 standard deviations higher than the dataset mean.
Conclusion
Single-cell RNA sequencing can pinpoint the molecular characteristics of sub-populations which may otherwise be difficult to elucidate. These observations may only occur in silico, but the findings can garner additional meaning when cross-referenced with public datasets and validated in follow-up studies. From here, Olah et. al establish that the newly identified “microglial cluster 7” is rarer in histological samples derived from Alzheimer’s patients.Appendix: Sub-Clustering and Annotation functions for Fractal Analysis on Pollock
- Pollock allows for the most flexible annotations of individual cellular events available for a single-cell viewer via three mechanisms:
- Importing annotations from within .h5ad files
- Importing trained ontology from personal data sets
- Interactive, manual cluster selection and annotation
- To practice a), let’s explore the cluster annotations imported from Olah et. al.
- We can manually isolate microglial subsets of interest from these annotations as defined by Olah et. al, excluding those associated with other myeloid lineages.
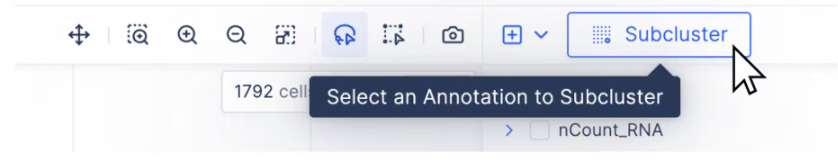
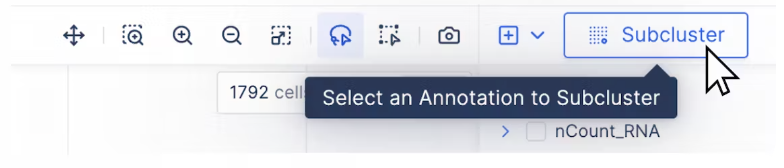
- We can then navigate to the “Subcluster” function, and re-run tSNE on the 9 annotated cell groups.
- After tSNE, we can visualize the emergence of new sub-groups, and continue to explore our data further.
- We can also manually select clusters [option c)] using the draw tool embedded in Pollock. We’ll leverage this tool to zoom in on a cluster associated with a specific disease state by selecting the “disease” annotation from the right annotation bar.
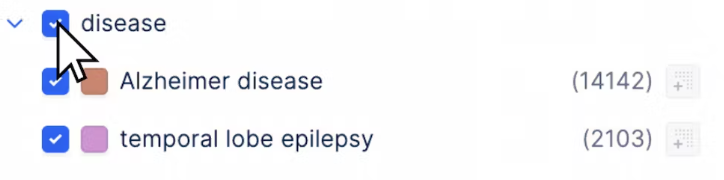
- This allows us to visualize the disease samples of interest. We can now use the Pollock selection tool to isolate cells from patients with “temporal lobe epilepsy”.
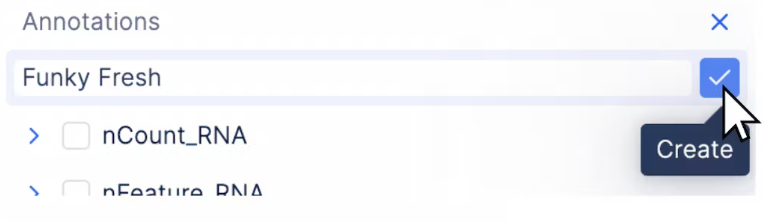
- Then, we can navigate to the “Annotations” bar and click the plus sign.
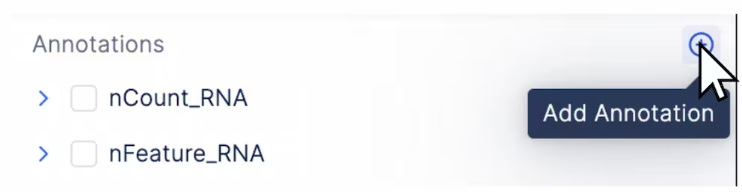
- Then create a brand new Annotation manually, and control those cell events with a single click.
- To further explore this cluster for intra-heterogeneity, we can run the “Subcluster” function and a UMAP dimensional reduction on the manually isolated population.
- UMAP embedding reveals several subclusters within the selected epilepsy disease group samples. To more closely examine these cellular events, we continue to subcluster further, or highlight differentially expressed genes to characterize distinct cell subsets.