This page provides a top-down overview of the Workflows product tab in Latch Console. It is useful for understanding what the tabs mean and how to navigate to them.
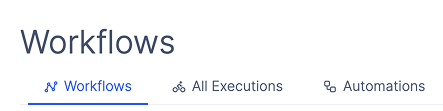
- Workflows: Include private and public workflows
- Executions: Include all executions that have been launched for all workflows in the current workspace
- Automations: Include all automations that have been created in the current workspace
Workflows
Go to Workflows Tab
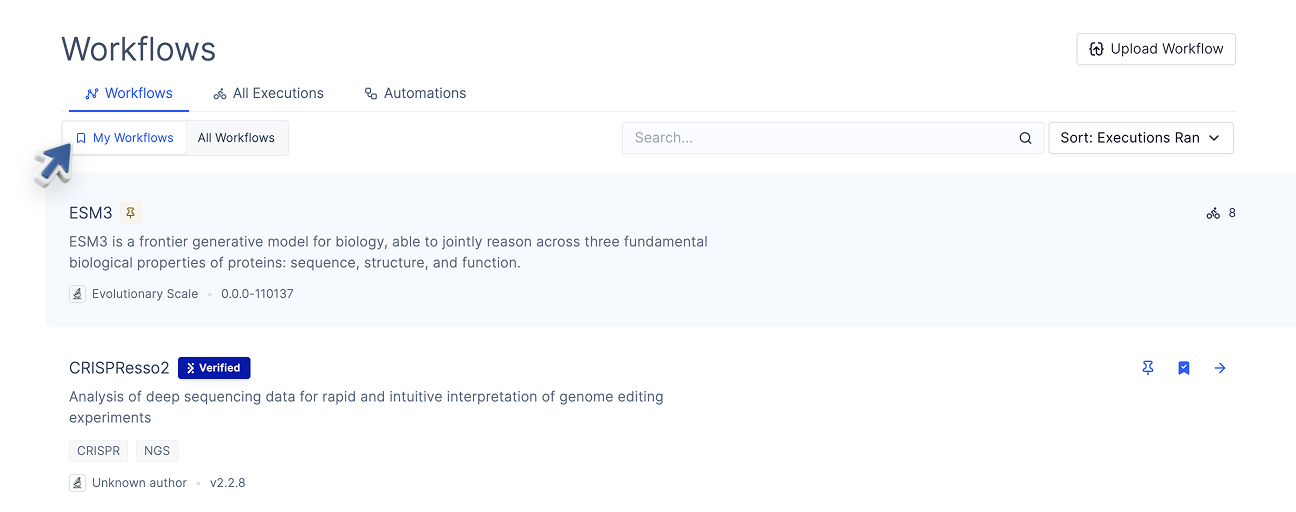
Include private workflows within a workspace and all public workflows.
My Workflows
- Shows all workflows that have been uploaded to your workspace, or added from the All Workflows tab.
- For developers, any workflow you have registered with the
latch registercommand will show up here.
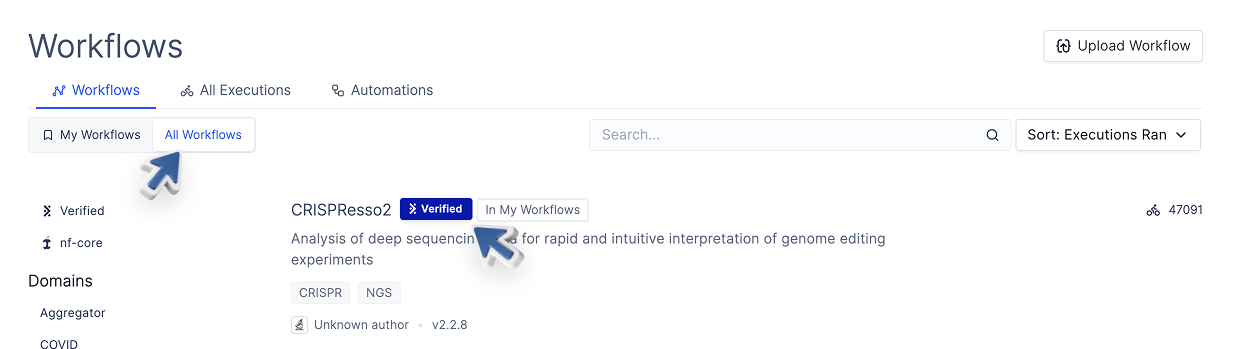
All Workflows
- Shows all publicly available workflows.
- Workflows with the “Verified” tag have been curated and battle-tested by the Latch engineering team. Community-built workflows are not actively vetted so their quality may vary.
For a specific workflow
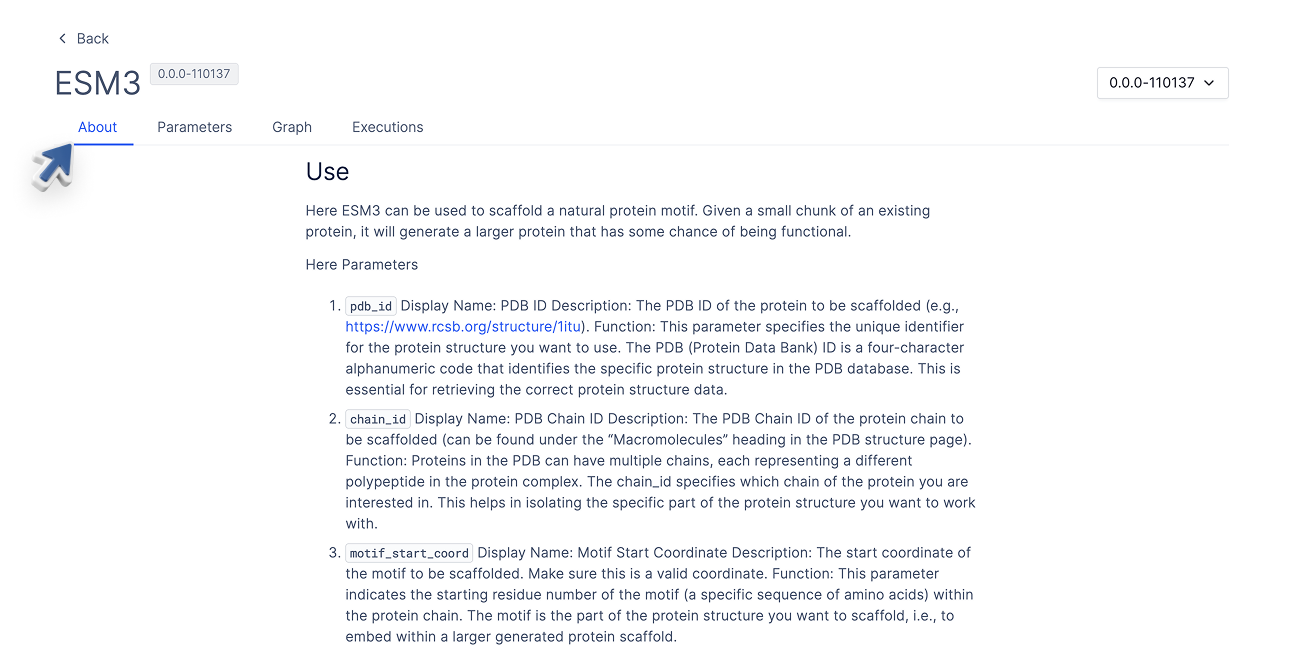
When you double-click on a specific workflow in “My Workflows” or “All Workflows”, you’ll be taken to the workflow’s dedicated page, which contains:- About page: Where the workflow author includes a description of the workflow, and any other relevant information. (For developers, learn how to customize the About page here).
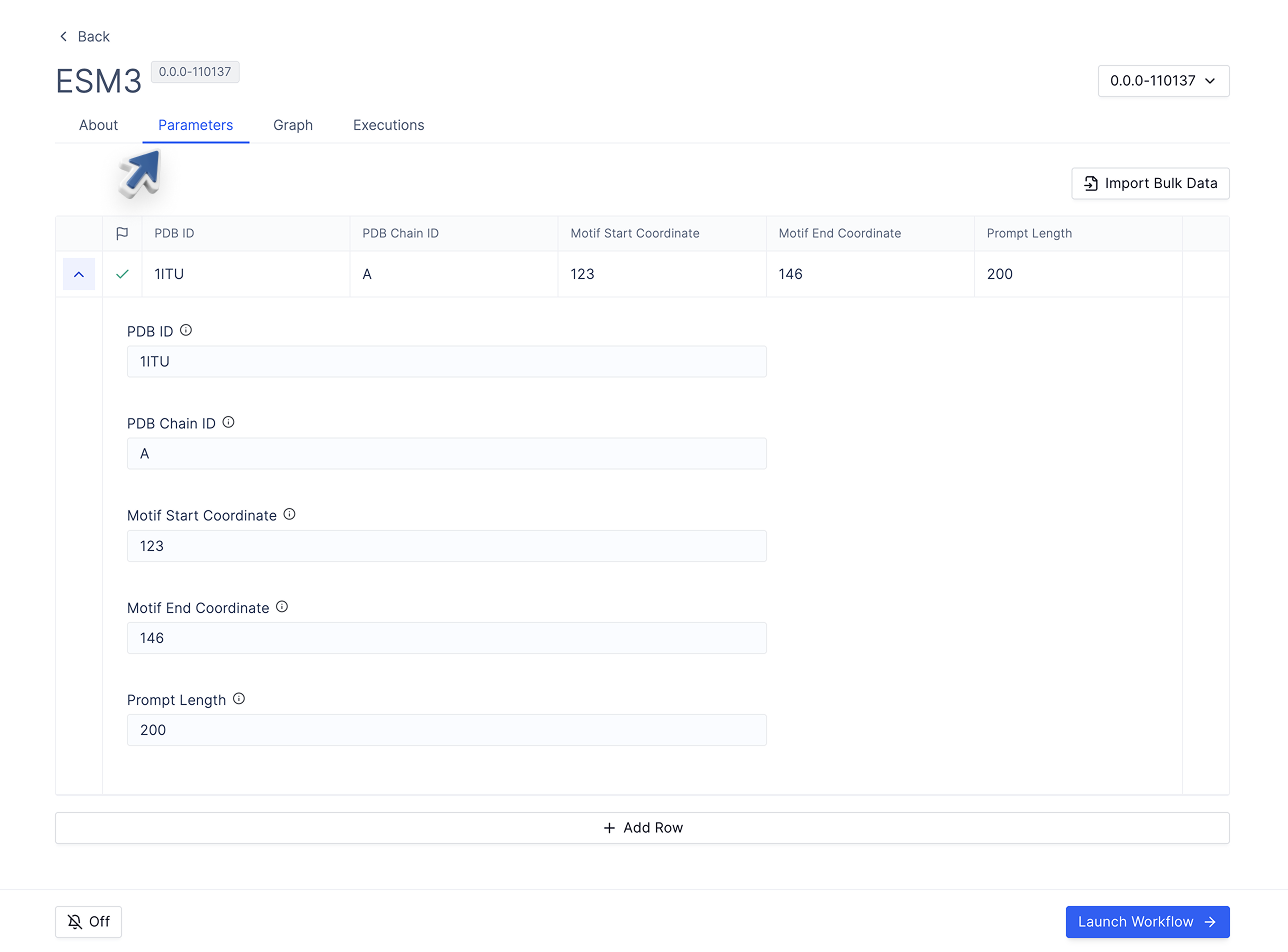
- Parameters page: Where you can fill out parameters and launch the workflow. For developers, learn how to customize the Parameters page here.
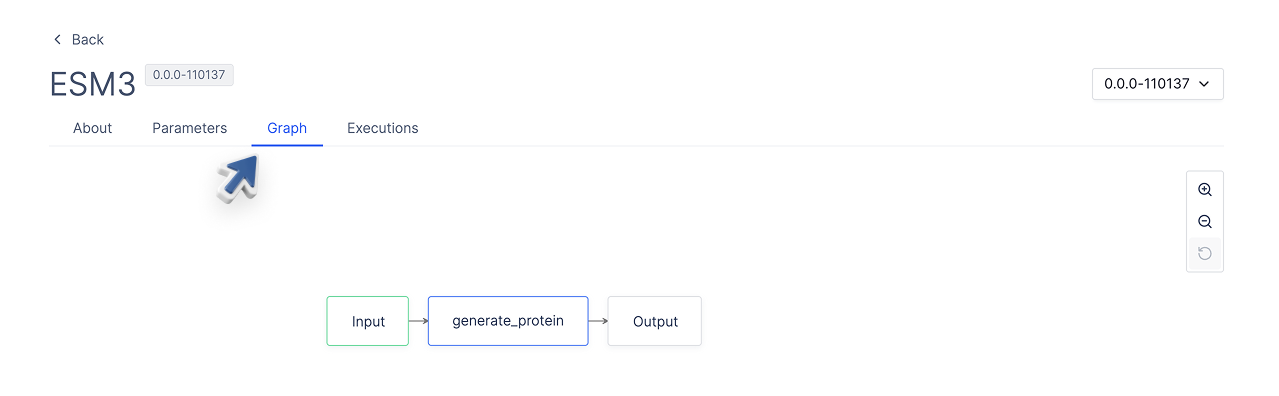
- Graph page: A visual representation of the workflow’s directed acyclic graph (DAG). When the workflow is launched, the DAG will be populated with the workflow’s task logs.
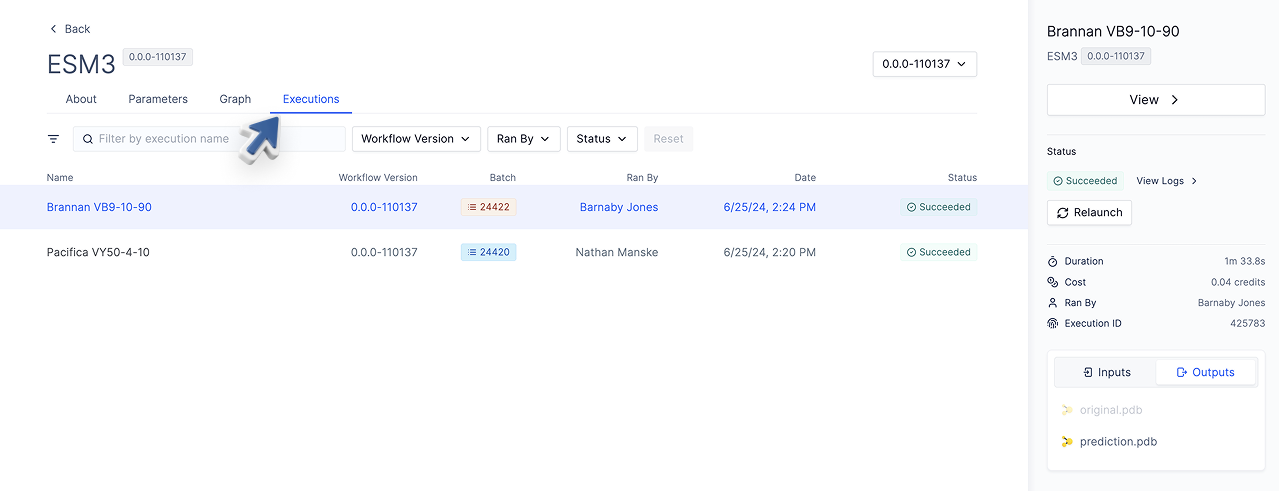
- Executions page: All past executions that have been launched for this workflow. You can filter by workflow version, status, and who it was run by.
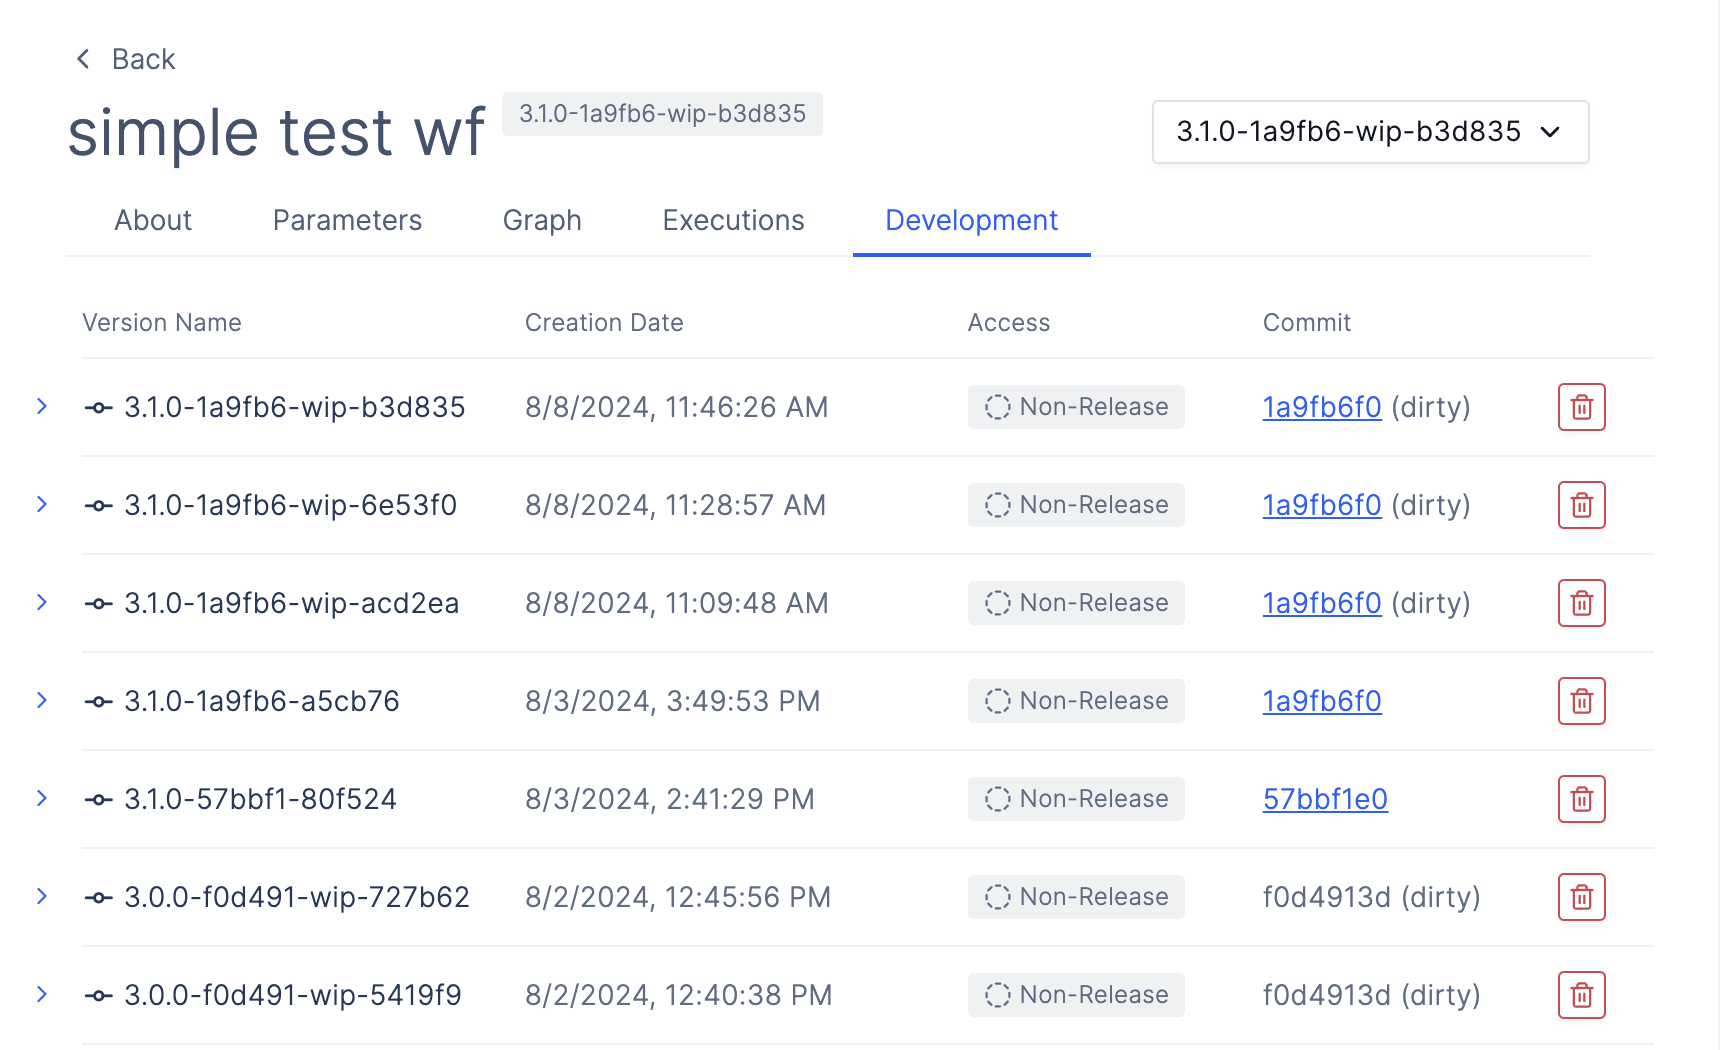
- (Optional) Development page: If you are the developer who registered the workflow, you will also see a Development tab, which tracks all workflow versions, creation date, release status, and associated Git commit. Visit the Development page to learn more.
Executions
Go to Executions Tab
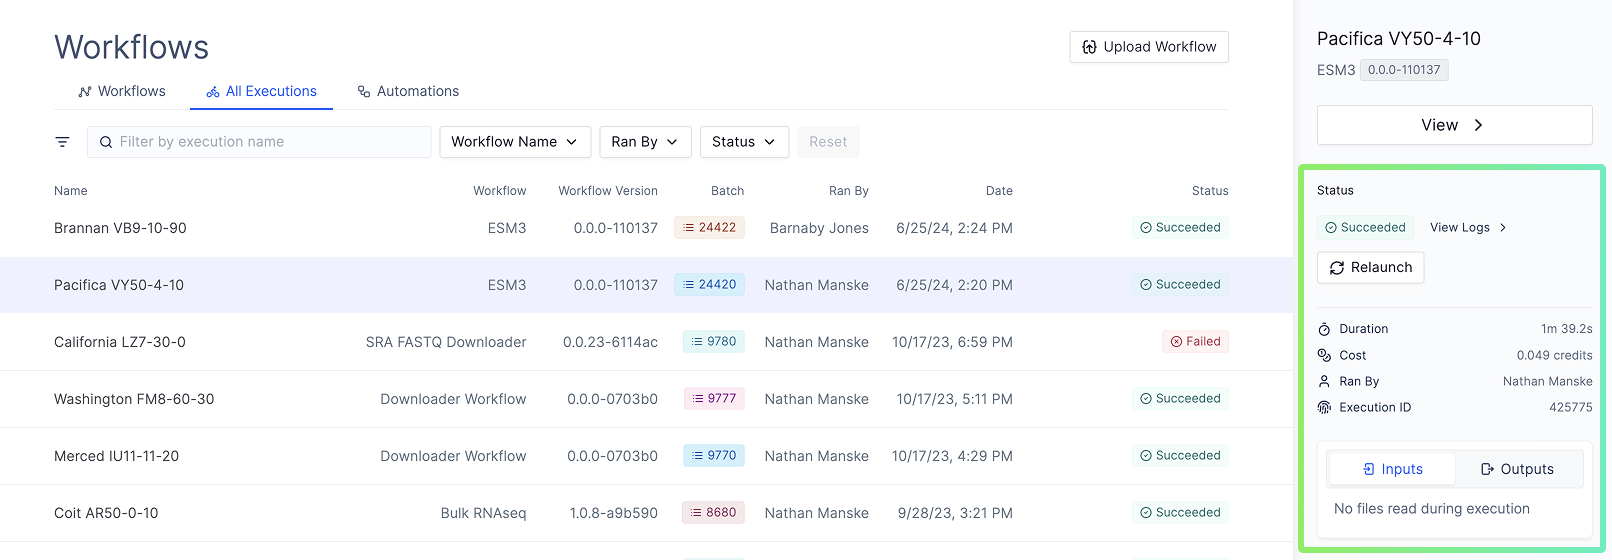
Show all executions that have been launched for all workflows in the current workspace.
For a specific execution
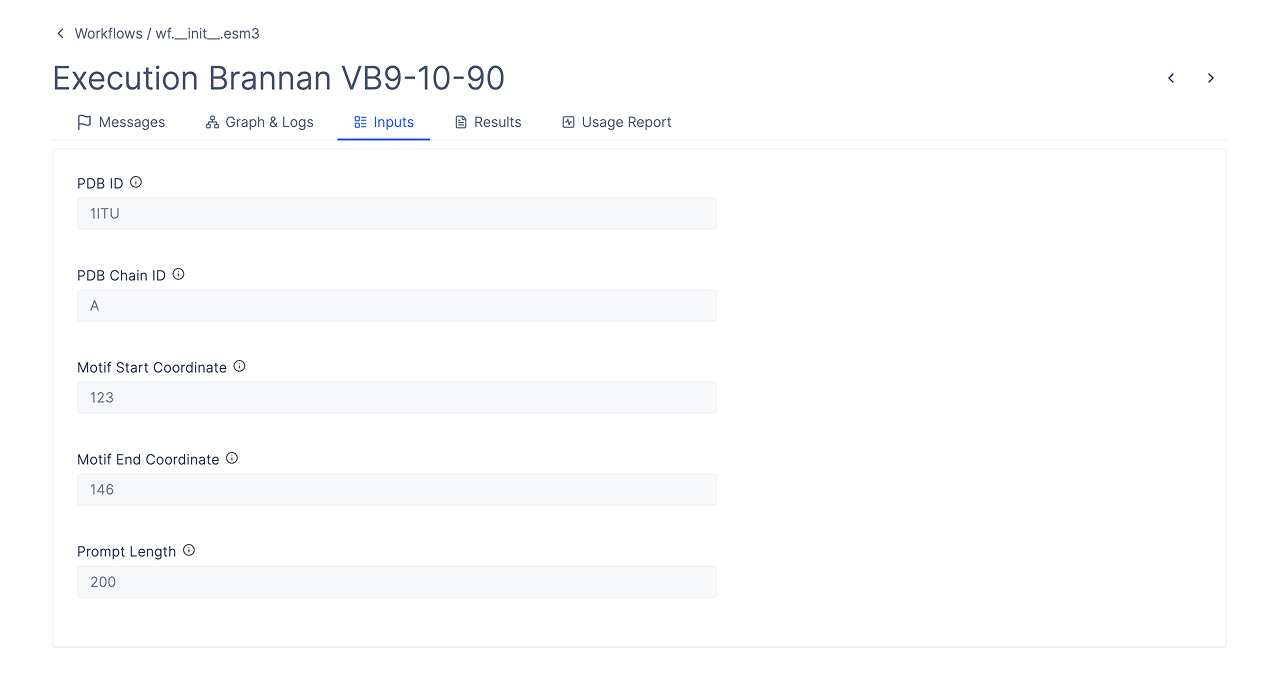
When you double click on a specific execution, you will see:- Inputs page: The inputs that were used to launch the workflow.
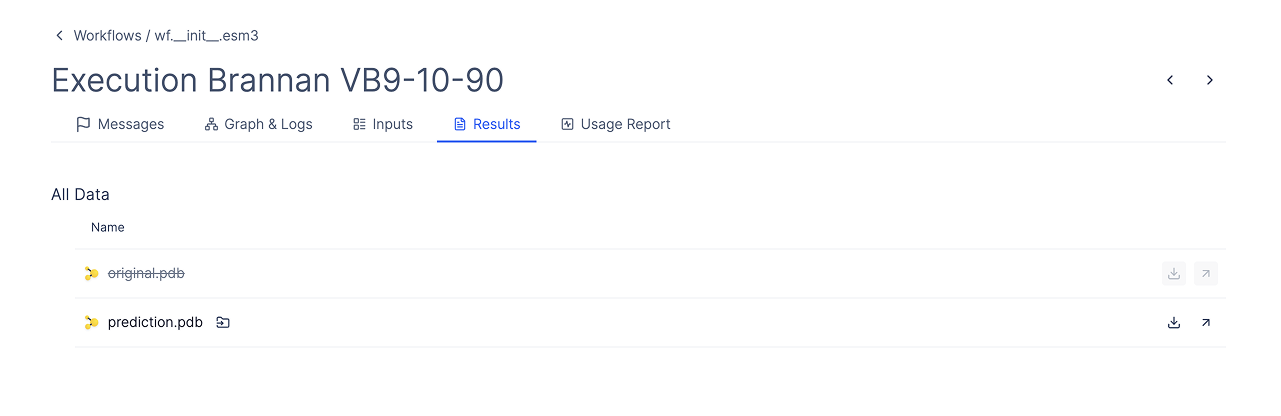
- Results page: The outputs that were generated by the workflow. (For developers: You can customize this page to highlight specific files you want to show scientists. Visit docuemntation here)
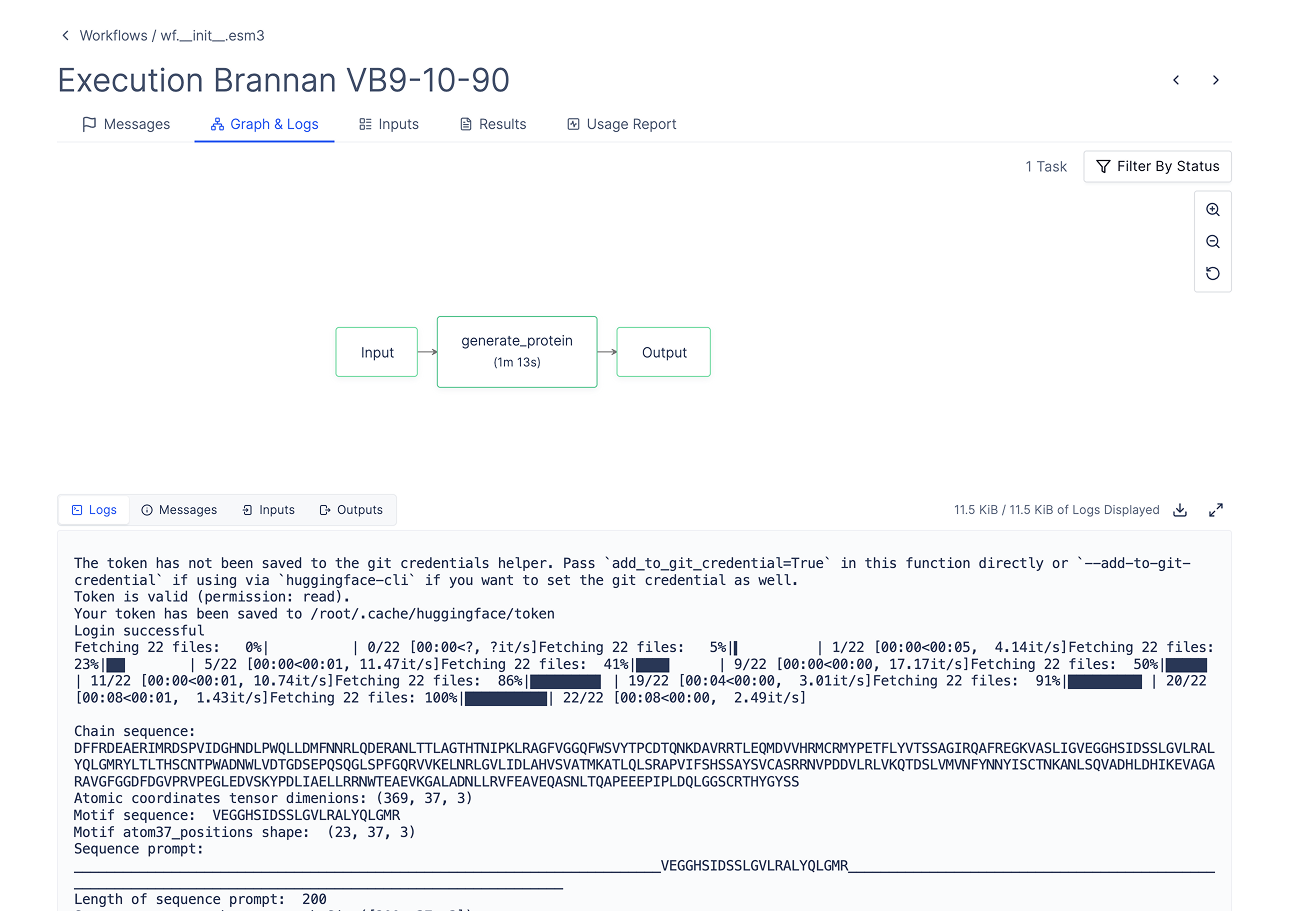
- Graph and Logs: Statuses and logs for all processes that were run as part of the workflow.
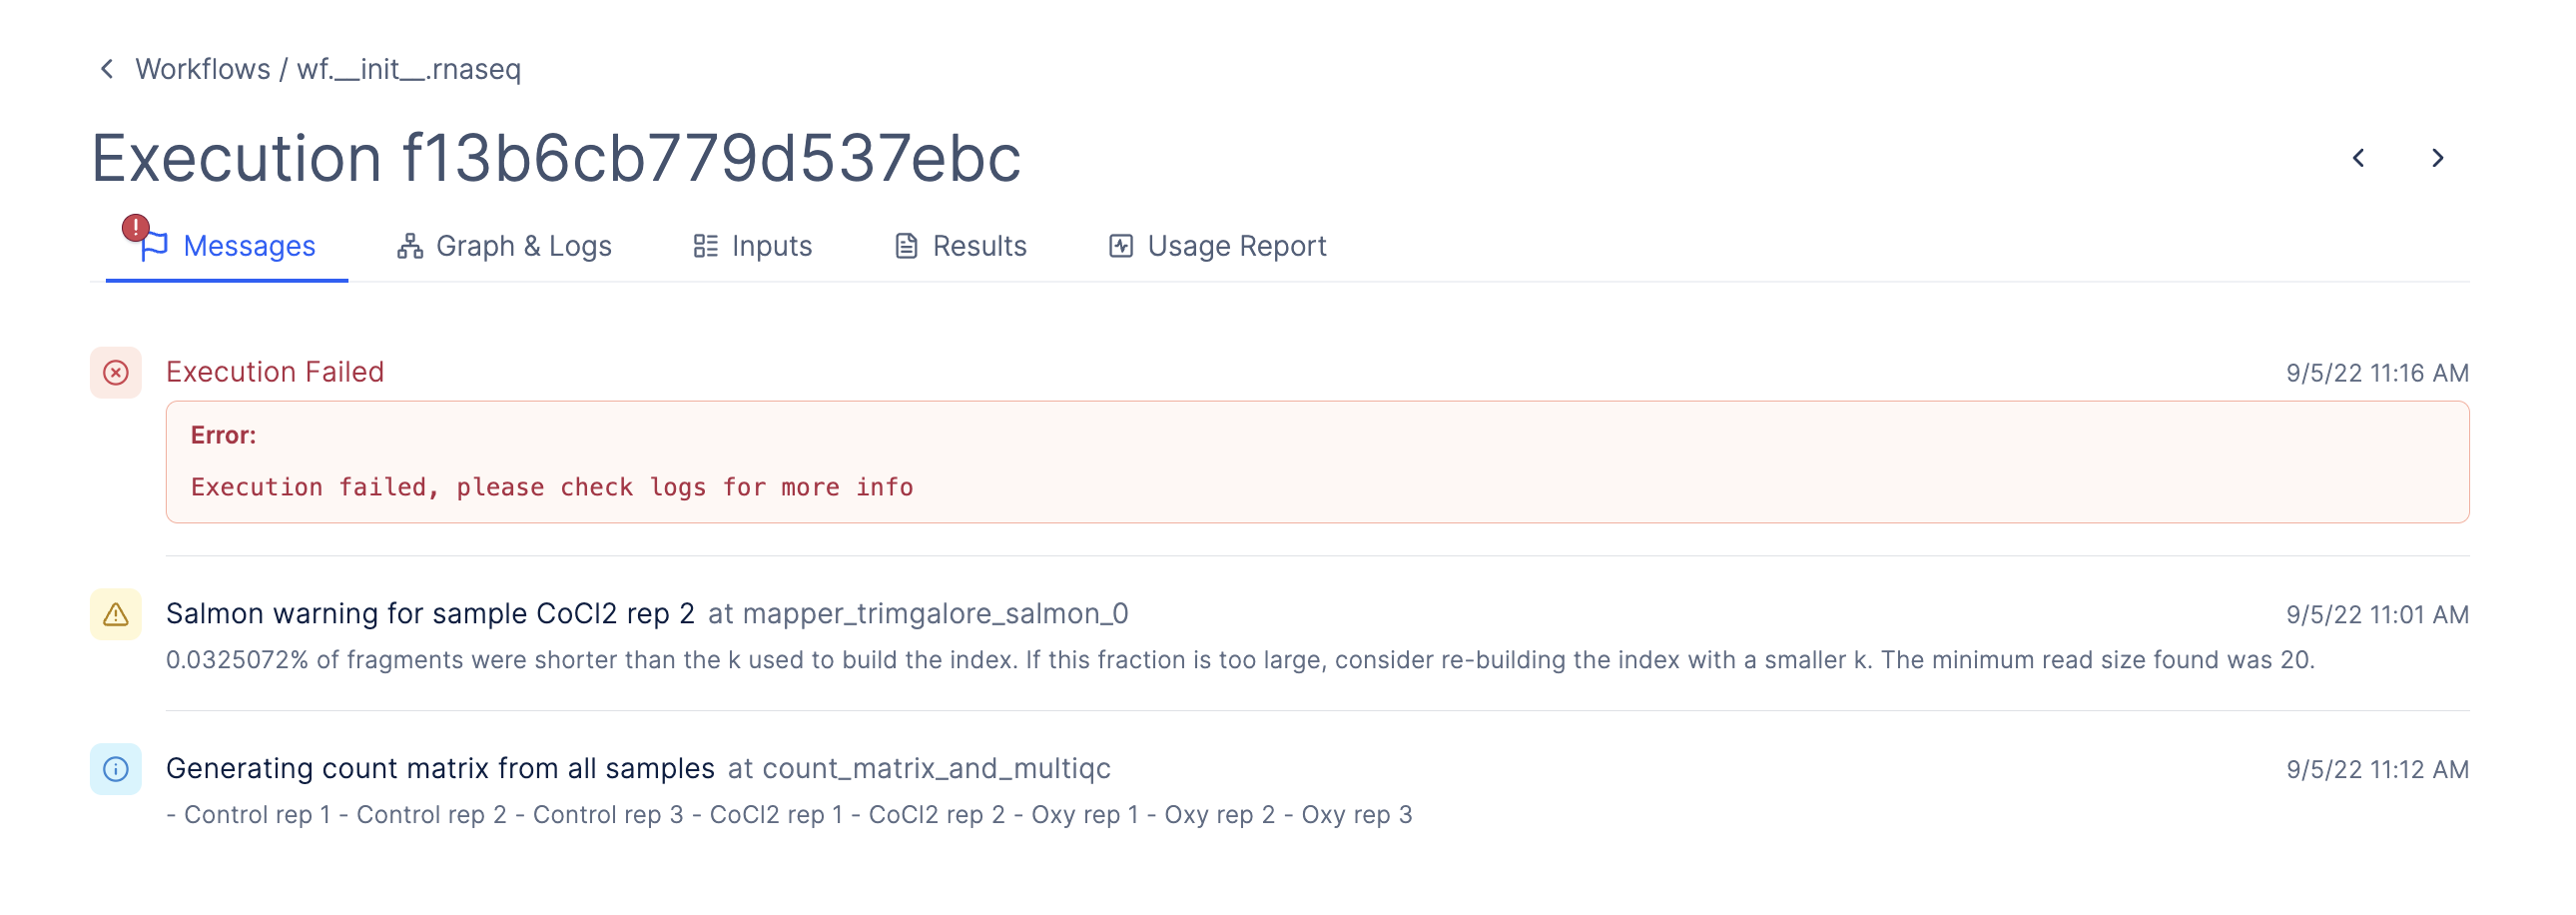
- Messages: Any messages that were generated by the workflow (For developers: You can customize this page to highlight specific messages you want to show scientists. Visit documentation here)
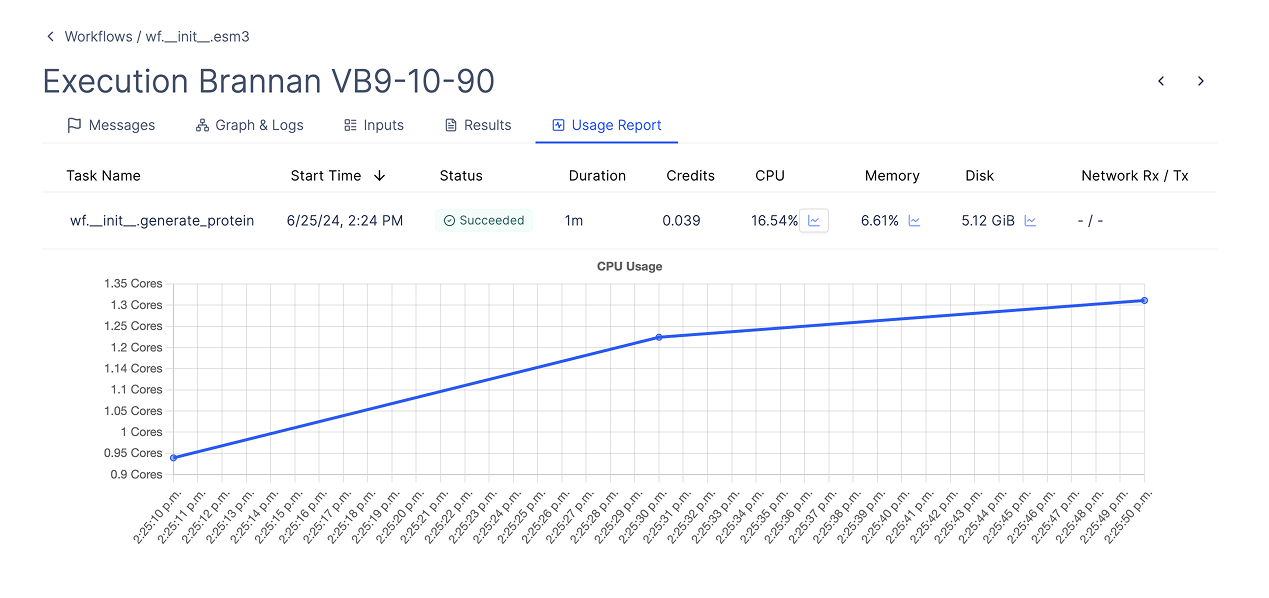
- Usage report: A summary of the resources that were used to run the workflow. (For developers: Learn more how to use the usage report to optimize your workflow here here)
- Sidebar: For every execution, on the sidebar, you can see duration, cost, who launched the workflow, inputs and outputs.
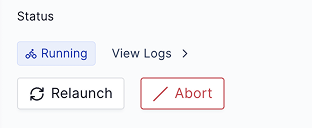
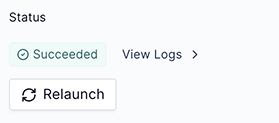
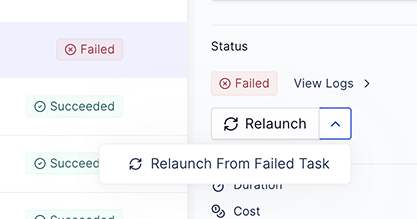
- Execution controls: On the same sidebar, and buttons to abort, relaunch, and relaunch from failed task.
-
Abort: Button is available if the workflow is still running and you want to stop it.
-
Relaunch: Button is available if the workflow has completed and you want to run it again.
-
Relaunch with a dropdown for “Relaunch from failed task”: Button is available if the workflow has completed but failed and you want to run it again from the failed task without rerunning successful upstream tasks.
-
Abort: Button is available if the workflow is still running and you want to stop it.
Automations
Go to Automations Tab
Place to create and manage automations.
- Visit Automations page to learn how to create and manage automations.