Downstream of NGS Processing
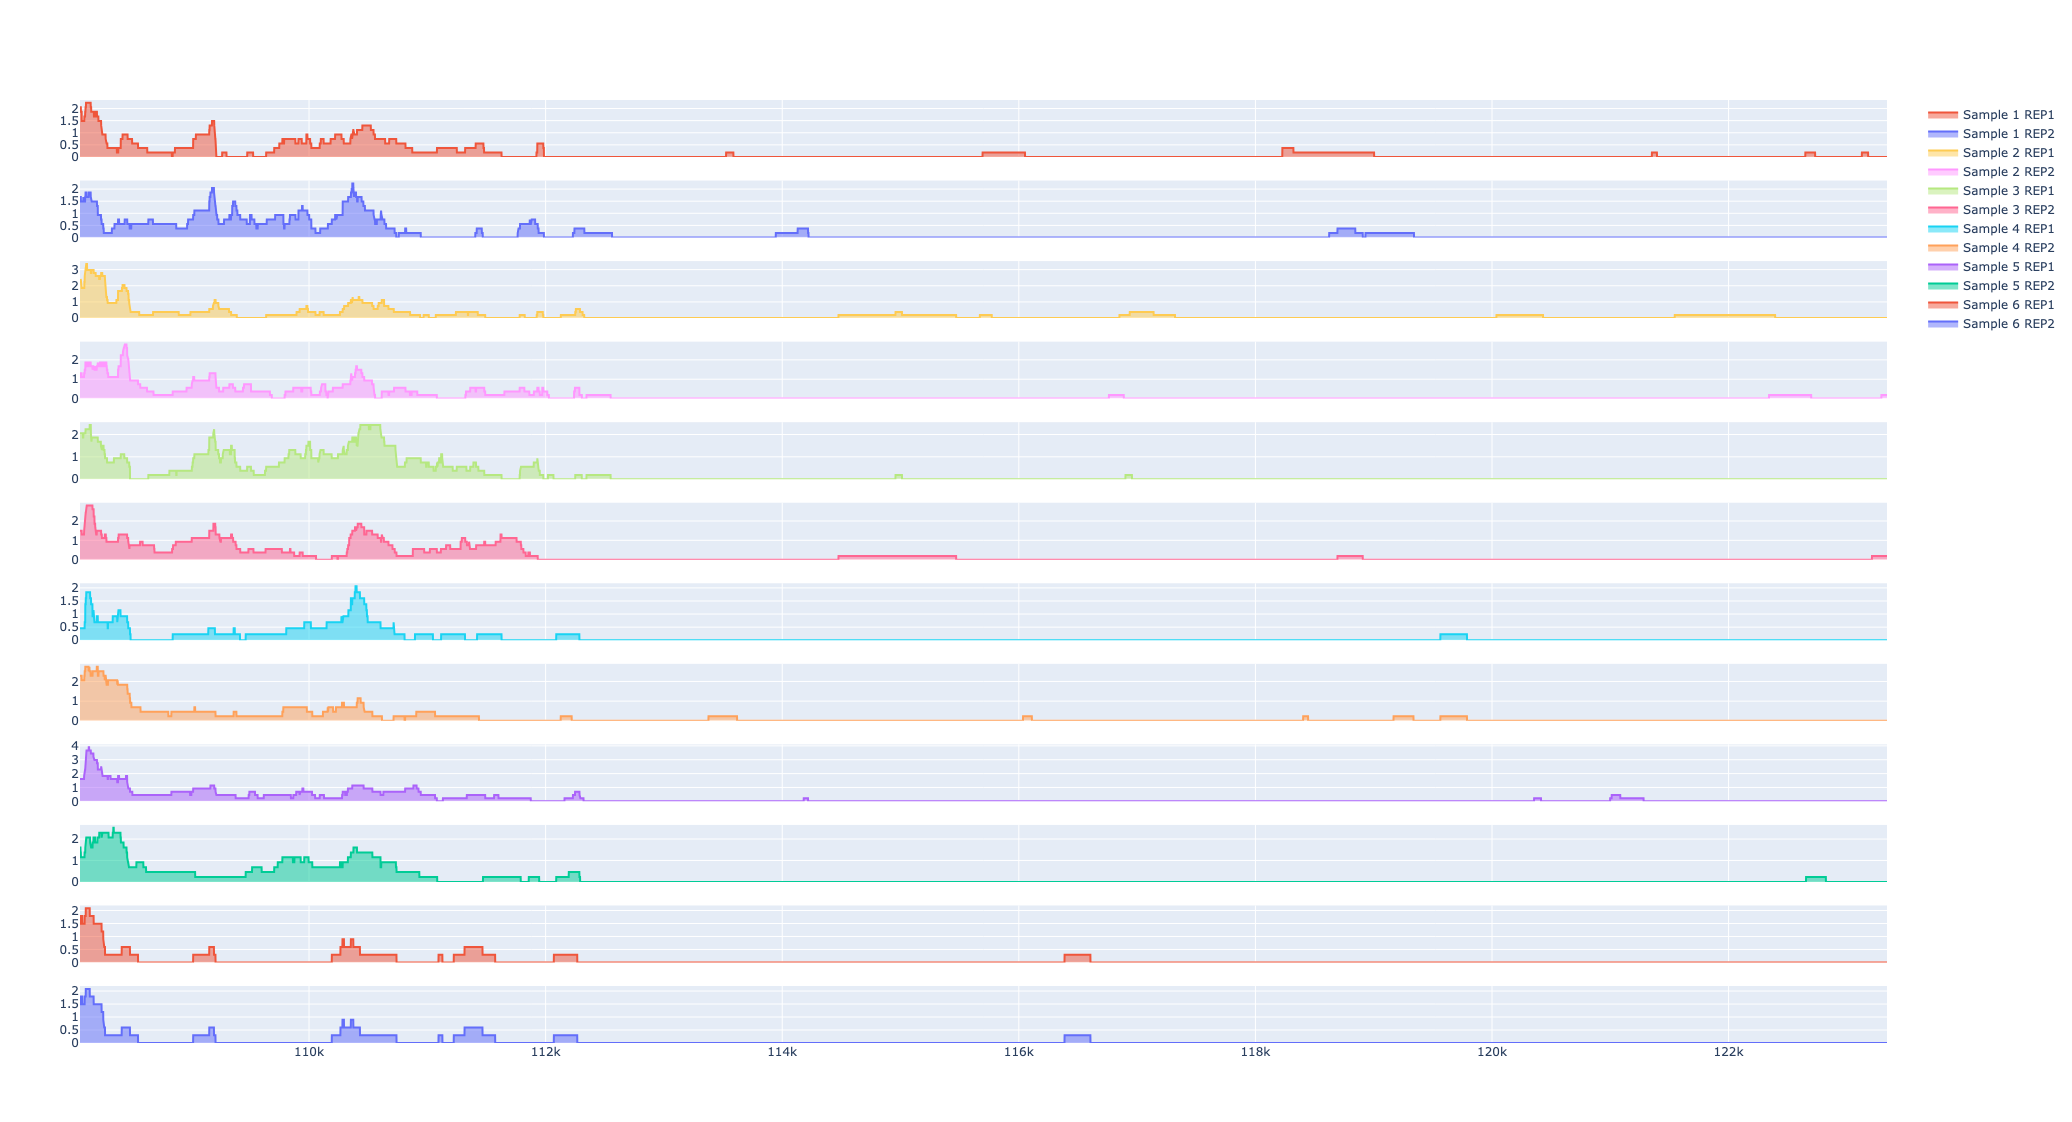
ATAC-seq
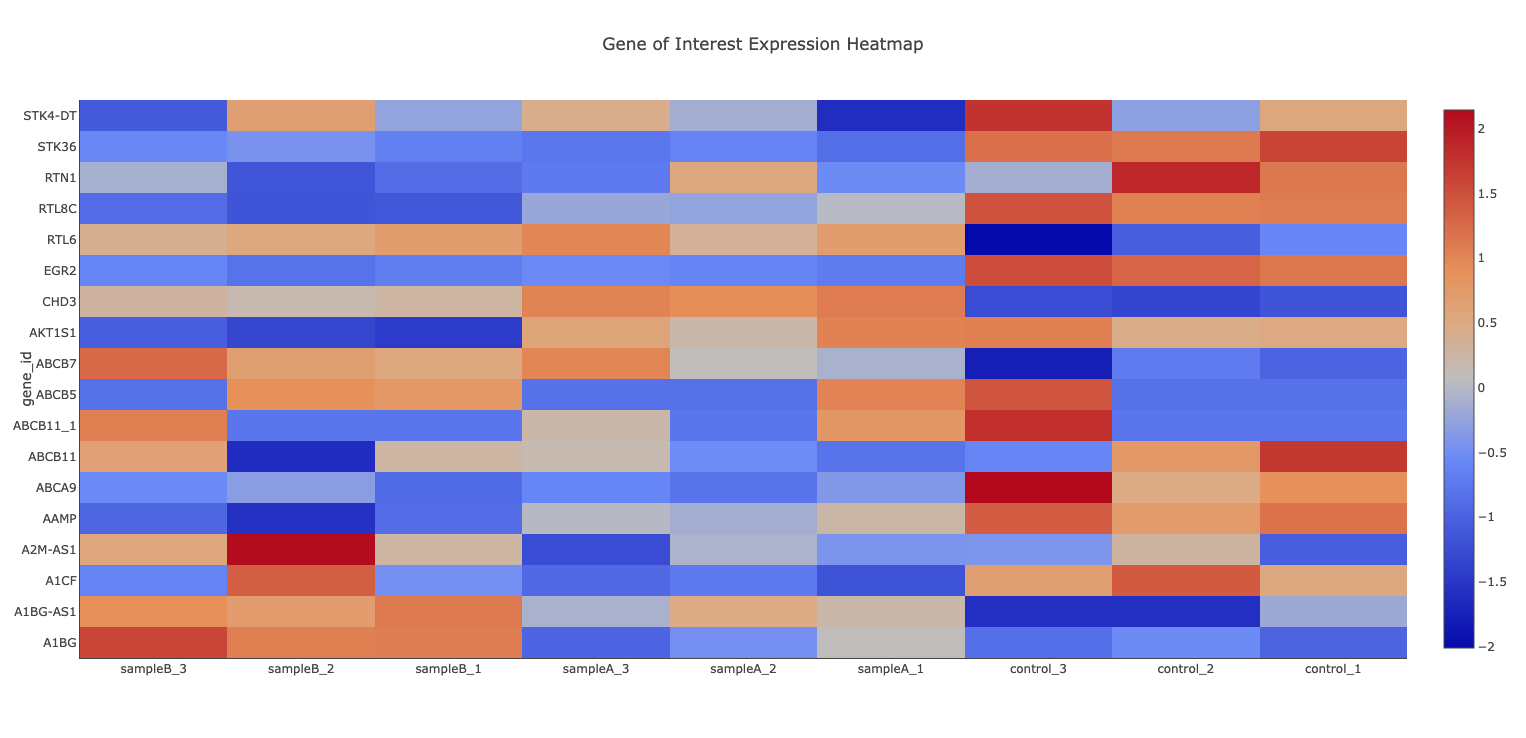
Differential Gene Expression
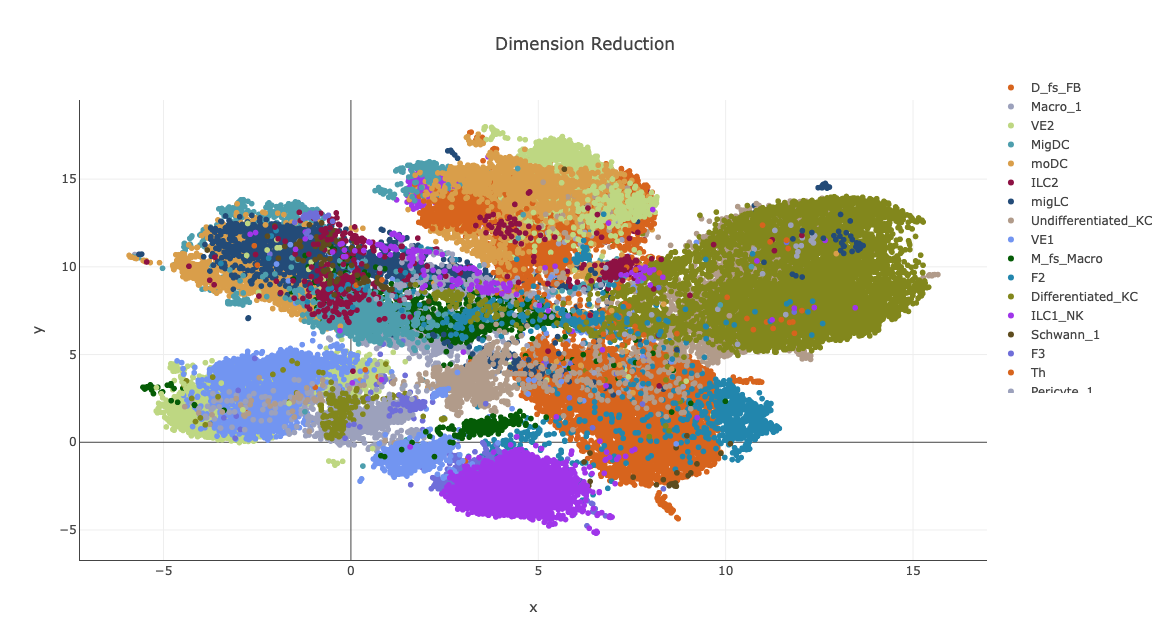
Single-cell RNA-seq
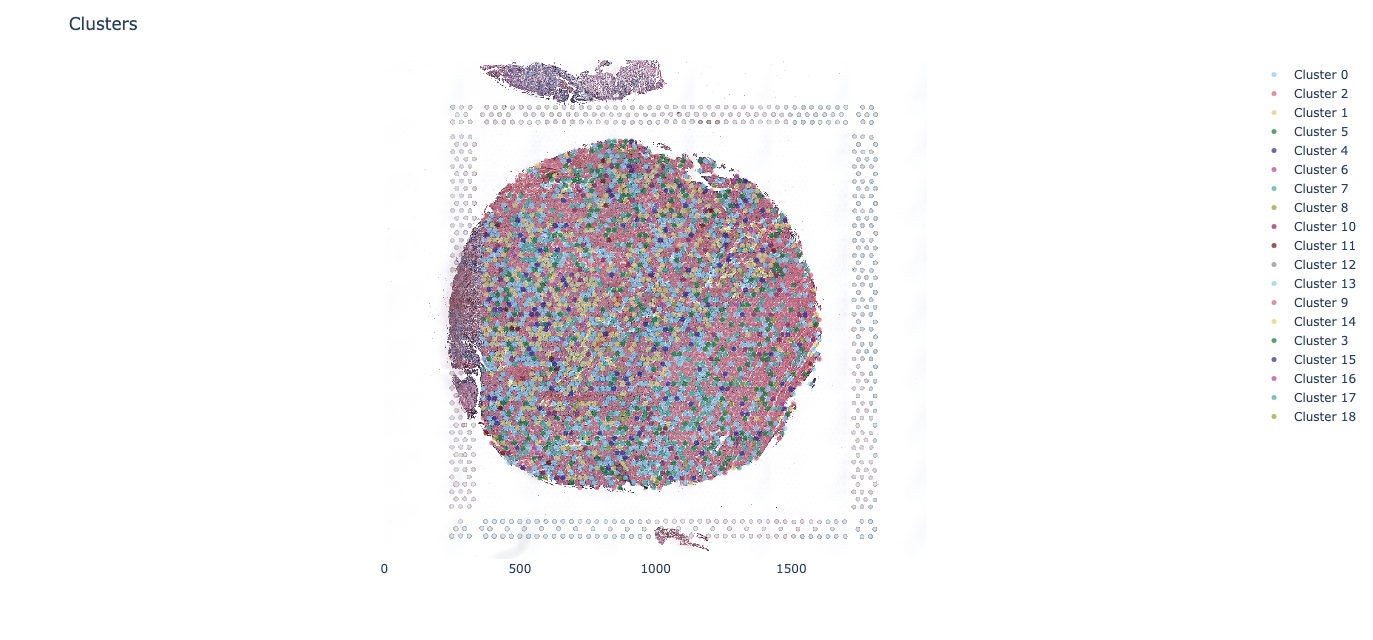
Spatial Transcriptomics
Biochemical Assays
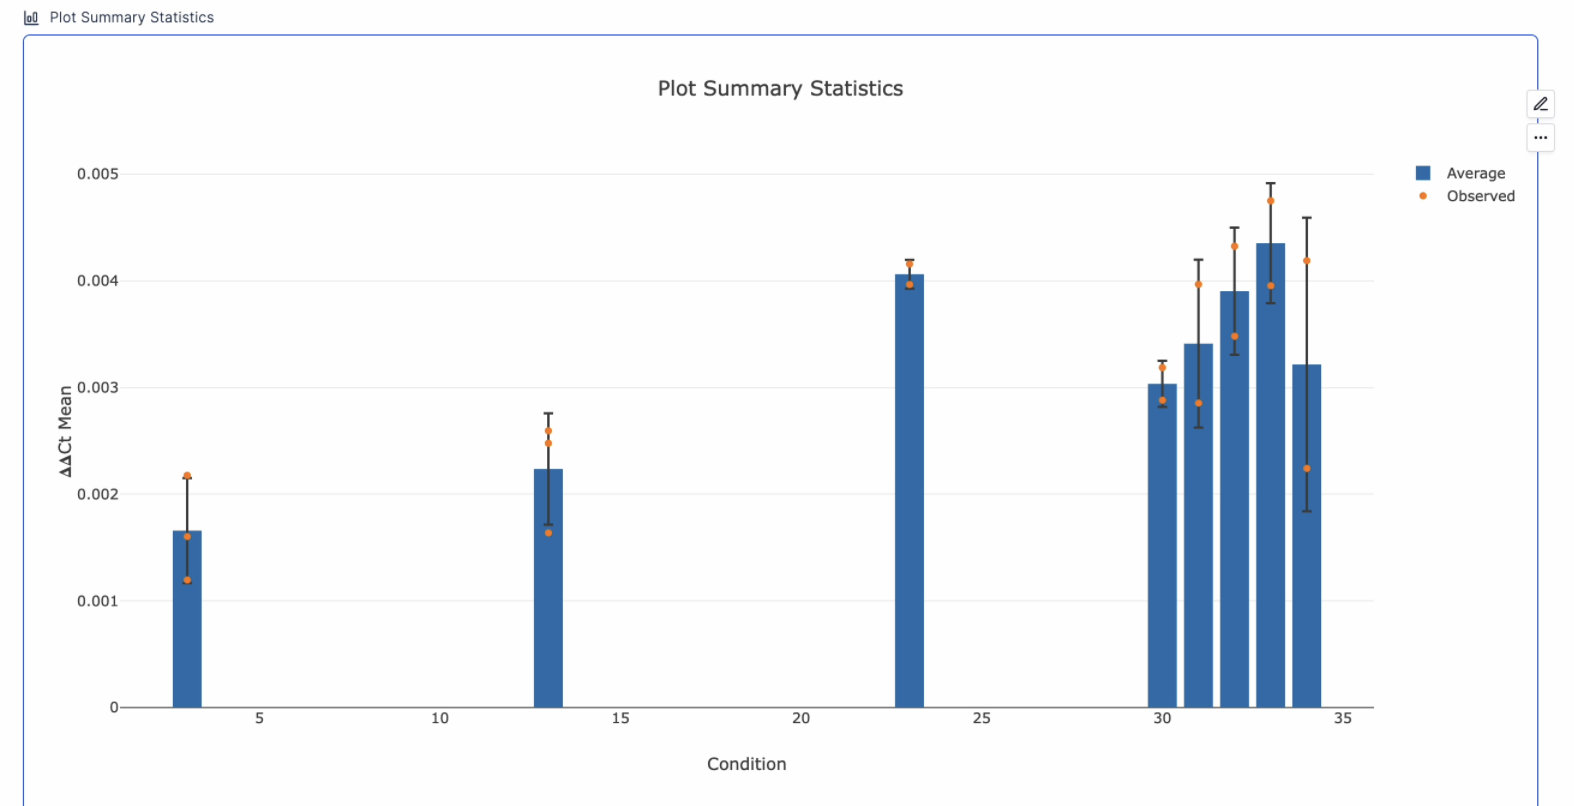
qPCR
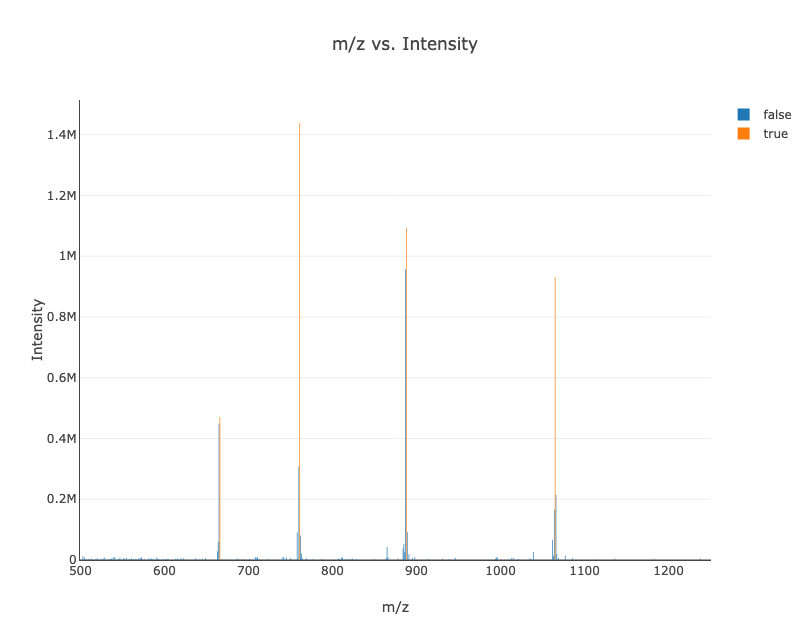
LC-MS
Statistical Analyses
Latch Plots also provide out-of-the-box statistical methods that you typically see in GraphPad Prism.Linear regression
IC50 dose curve fitting
Outlier detection
One-way and two-way ANOVA
t-test
Correlation analysis