from lplots.widgets.text import w_text_input
from lplots.widgets.multiselect import w_multi_select
from datetime import datetime
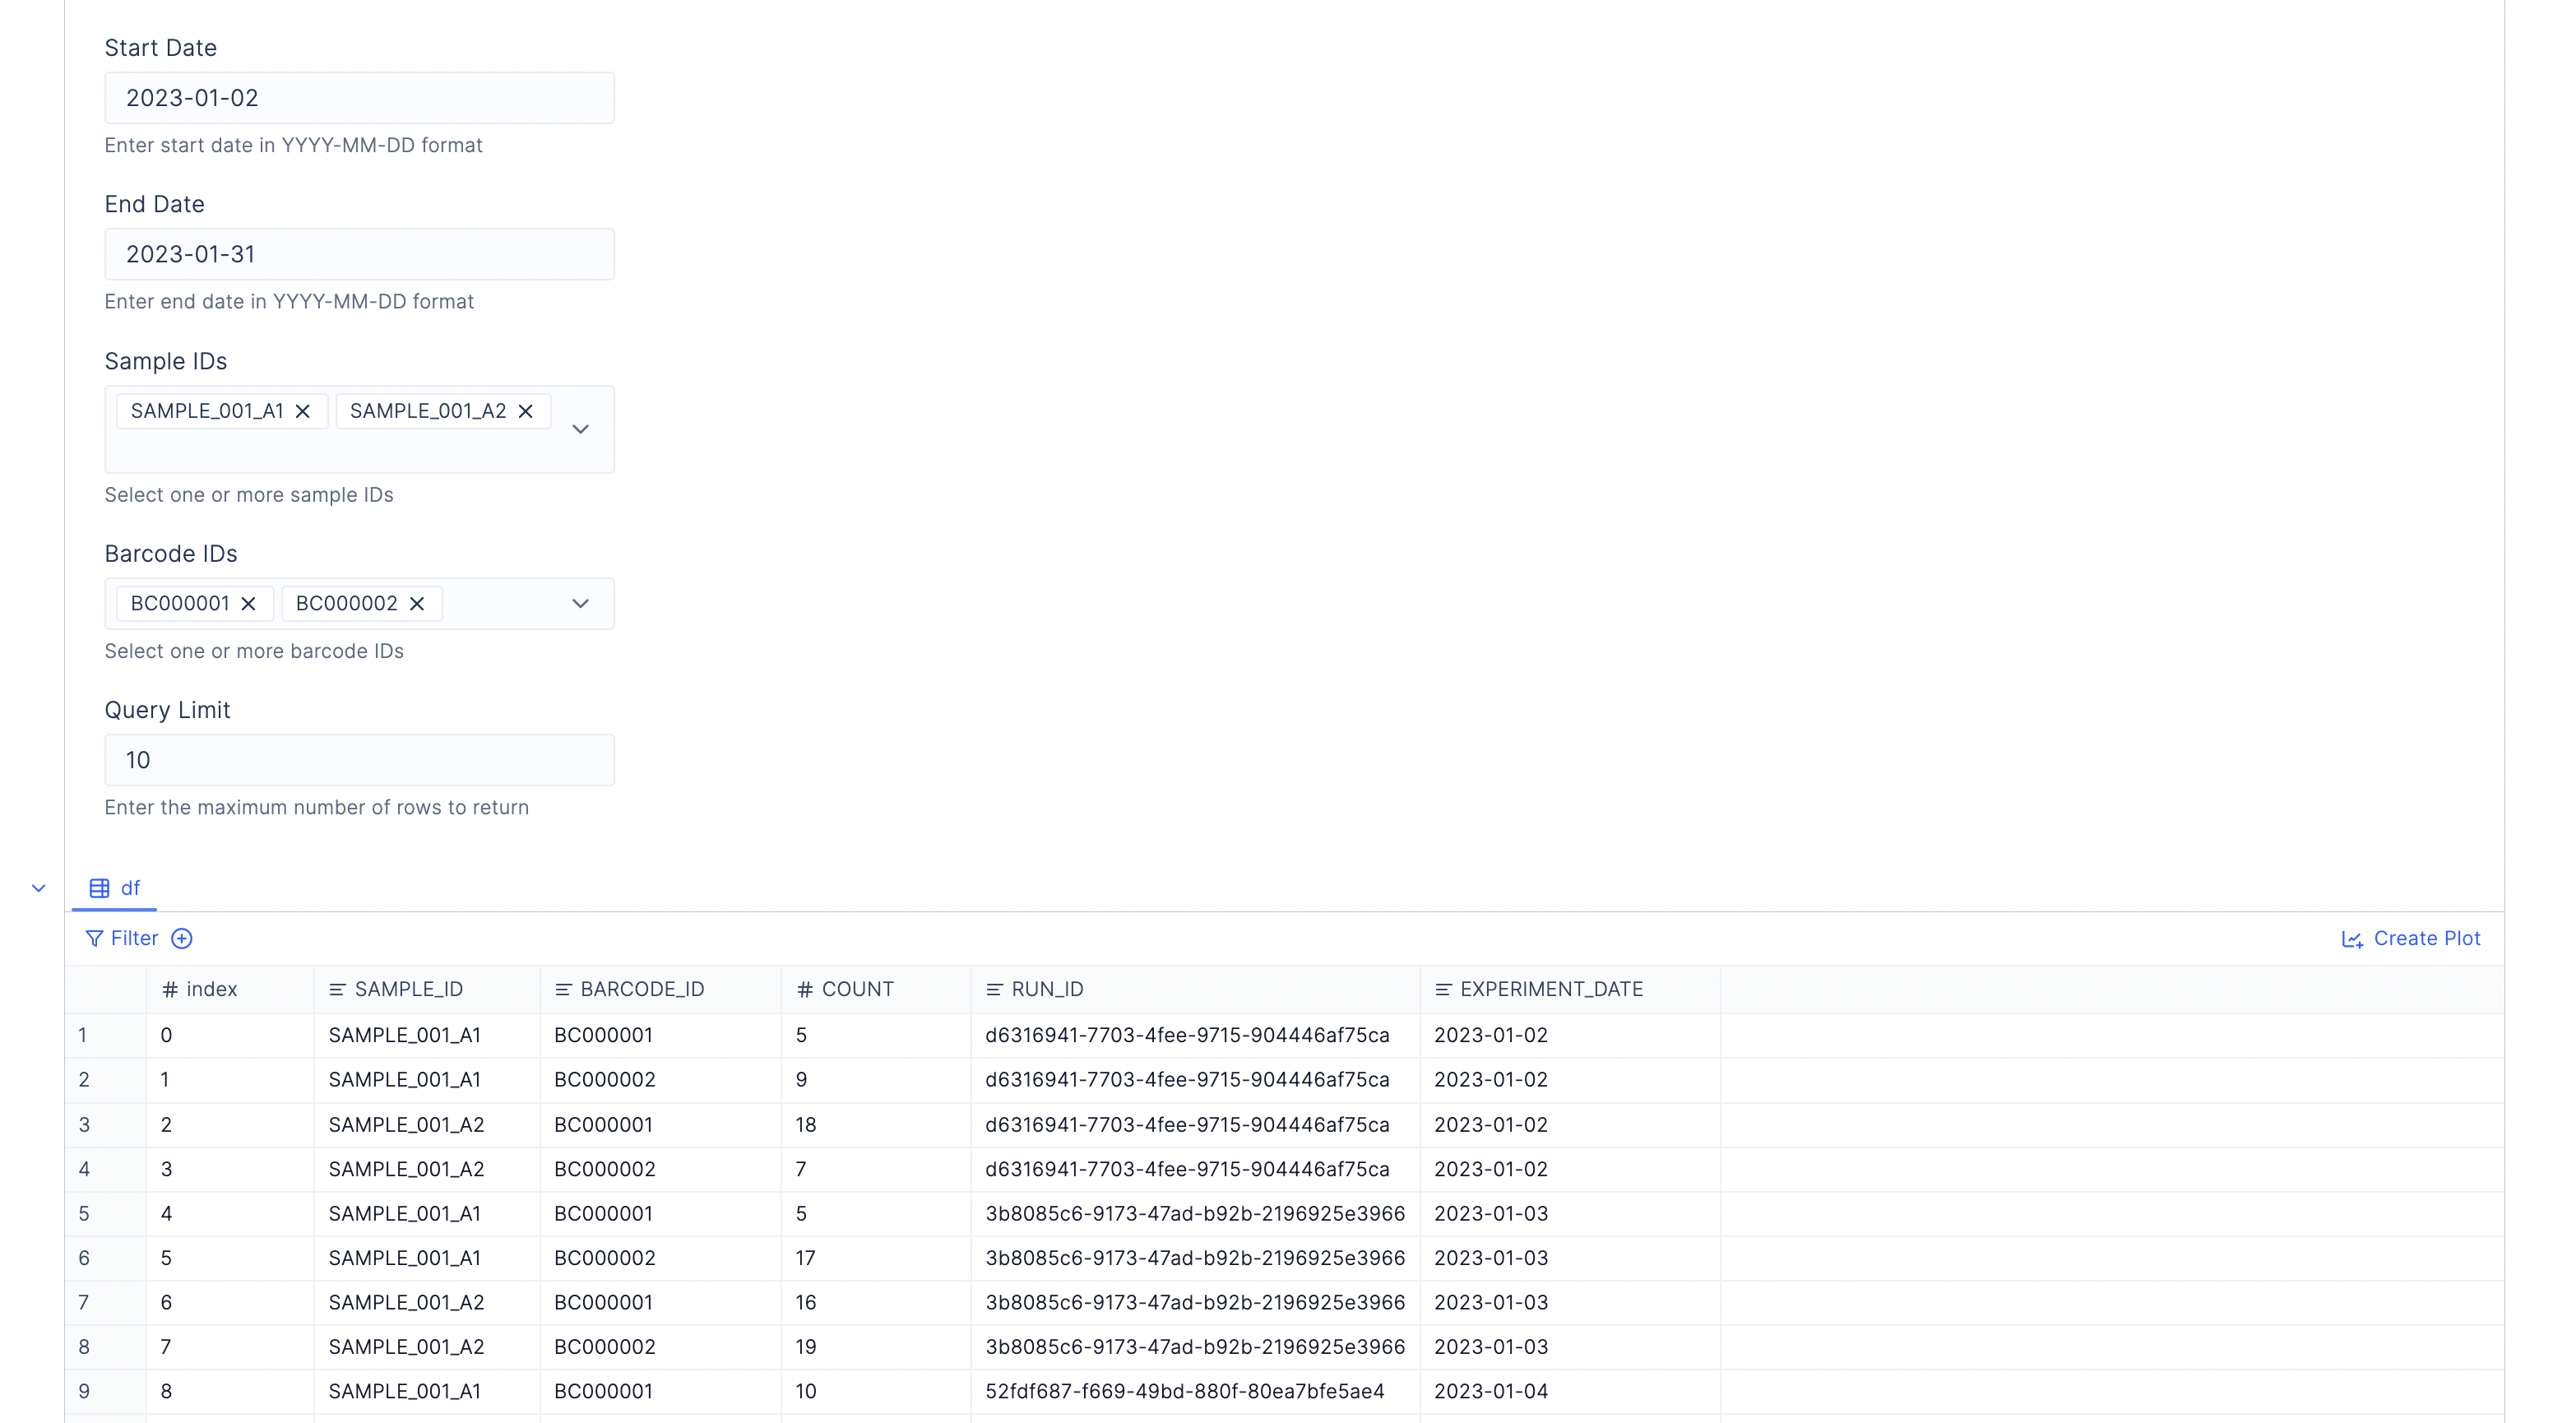
start_date = w_text_input(
label="Start Date",
default="2023-01-01",
appearance={"help_text": "Enter start date in YYYY-MM-DD format"}
)
end_date = w_text_input(
label="End Date",
default="2023-01-31",
appearance={"help_text": "Enter end date in YYYY-MM-DD format"}
)
sample_ids = w_multi_select(
label="Sample IDs",
options=['SAMPLE_001_A1', 'SAMPLE_001_A2', 'SAMPLE_001_A3'],
appearance={"help_text": "Select one or more sample IDs"}
)
barcode_ids = w_multi_select(
label="Barcode IDs",
options=['BC000001', 'BC000002', 'BC000003'],
appearance={"help_text": "Select one or more barcode IDs"}
)
limit = w_text_input(
label="Query Limit",
default="1000",
appearance={"help_text": "Enter the maximum number of rows to return"}
)
base_query = """
SELECT
sample_id,
barcode_id,
count,
run_id,
experiment_date
FROM barcode_counts
WHERE experiment_date BETWEEN %(start_date)s AND %(end_date)s
"""
params = {
'start_date': start_date.value,
'end_date': end_date.value
}
if sample_ids.value:
base_query += " AND sample_id IN ('" + "','".join(sample_ids.value) + "')"
if barcode_ids.value:
base_query += " AND barcode_id IN ('" + "','".join(barcode_ids.value) + "')"
base_query += """
ORDER BY experiment_date, sample_id
LIMIT %(limit)s
"""
params['limit'] = int(limit.value)
with snowflake_connection(SnowflakeConfig.build()) as conn:
df = pd.read_sql(base_query, conn, params=params)
df