Cell Types
All supported cell types in a notebook
Notebook Runtime
Key concepts around notebook compute resources, environments, and kernel sessions
Notebook Status
All notebook statuses and what they mean
Notebook Actions
Available actions for running cells, restarting the kernel, and more
Edit vs. App Mode
Differences between Edit and App mode
Cell Types
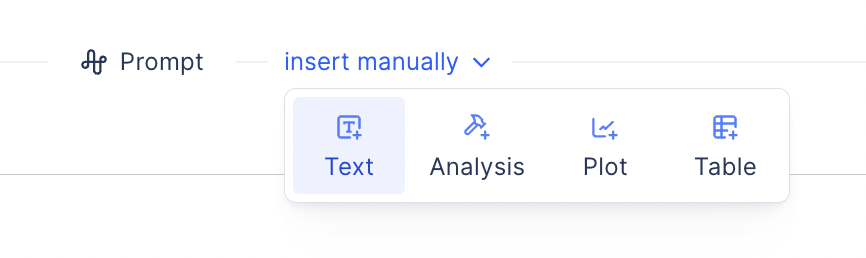
- Plotting Cells Plot cells allow you to plot your tabular data using various configurable chart types.
- Analysis or Python Cells Analysis cells allow you to analyze and process data using Python and UI widgets.
- Table Display/Filtering Cells Table display/filtering cells allow you to display a selected tabular data source (can be from a transform cell, csv, Excel, or registry) and filter that data for use downstream.
- Text Cells Text cells use markdown to display explanatory text or figures in a layout
Notebook Runtime
A notebook runtime is the compute environment that executes the code within a notebook. Technically, it consists of:- Kernel: A language-specific process (e.g., Python, R) that receives, executes, and returns the output of code cells.
- Compute Resources: CPU, GPU, RAM, and storage allocated to support execution, data loading, and in-memory operations. Each Plot notebook is backed by one dedicated computer with resources you can adjust.
-
Environment Context: The software environment, including installed packages, environment variables, and file system structure available during execution.
By default, each Plot notebook uses packages defined in the
plots-faasconda environment. - Session State: Keeps track of defined variables, function definitions, loaded data, and execution history within the notebook session.
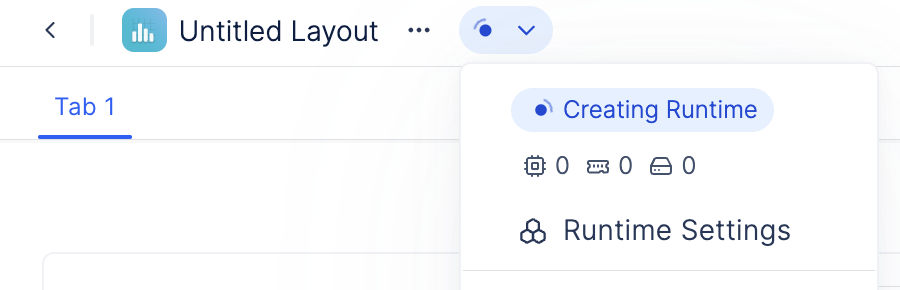
Notebook Statuses
Each Plot Notebook is backed by a dedicated virtual machine. When you create or open a notebook, it transitions through several runtime states:- Creating Runtime: A new virtual machine is being provisioned for the notebook.
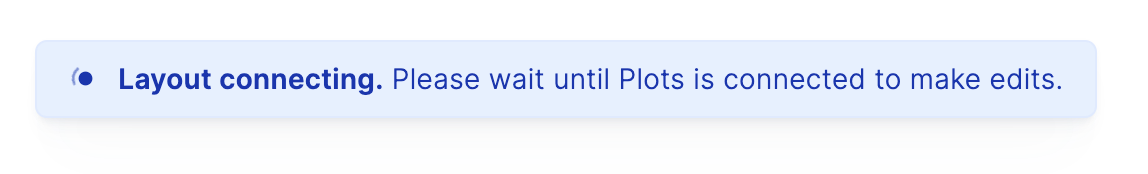
- Layout Connecting: The virtual machine is starting up, and the notebook frontend establishes a WebSocket connection to the runtime.
- Initializing: Once connected, all notebook cells are automatically executed in order. If the notebook has multiple tabs, initialization will run all cells across all tabs.
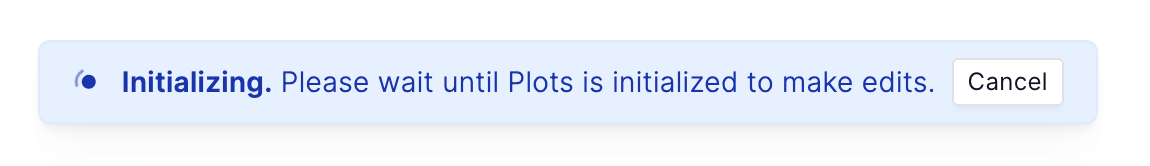
Auto-running all cells is the default behaviour. You also have the option to disable auto-running by clicking Edit and turn off Autorun enabled.
- Connected: The notebook is connected and ready to be use.
- Dormant: The notebook is shutdown. The session state, which includes in-memory variables and functions, are cleared. However, all files and installed dependencies stored on disk are persisted and will be available the next time the notebook is launched.
By default, a notebook automatically shuts down after 1 hour of inactivity (i.e., when no user is actively viewing it).
Notebook Actions
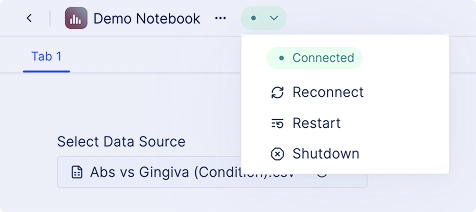
- Restart: Terminates the current session and clears all in-memory variables and session state. A new WebSocket connection is established, and all notebook cells are automatically re-executed from top to bottom.
- Shutdown: Terminates the current session and clears all in-memory variables and session state.
- Reconnect: Reconnects to a recently shutdown session.
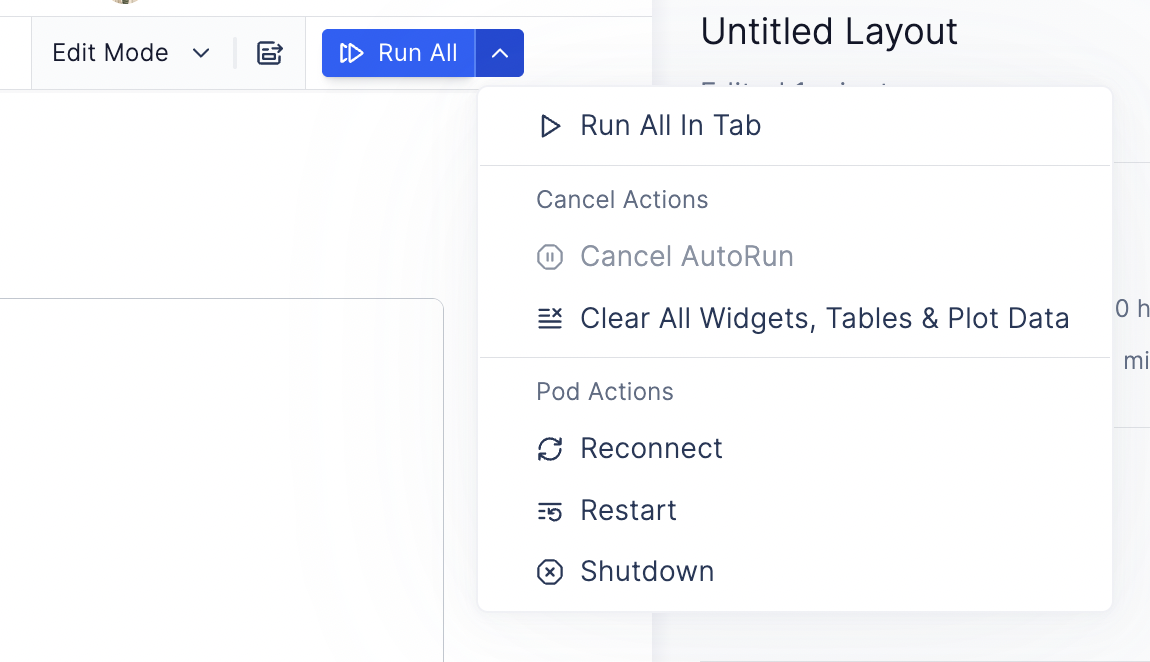
- Run All: Executes all cells across the entire notebook, including all tabs if using a tabbed layout.
- Run All in Tab: Executes only the cells within the currently visible tab.
- Cancel Autorun: When the notebook first connects and begins auto-running all cells, you can interrupt this process by clicking “Cancel autorun” if it’s taking too long or if you want to run specific cells manually.
- Clear All Widgets, Tables & Plots Data: Resets all widget states to their default values and re-runs the associated cells. If your code uses conditionals (e.g., skipping computation when widgets are None), clearing the widgets will also clear any dependent tables or plots that rely on user input.
Edit vs. App Mode
On the left-hand side of the notebook, next to the “Run All” button, there is an icon that allows you to toggle betwee Edit mode and App mode.
Overall, App Mode provides users with a simple, application-like experience. The underlying notebook interface is hidden, making it indistinguishable from a standalone web app.