> ## Documentation Index
> Fetch the complete documentation index at: https://wiki.latch.bio/llms.txt
> Use this file to discover all available pages before exploring further.
# Resource Monitoring
> Workflows on Latch provide visibility into the resource usage of each task execution, enabling developers to easily debug and optimize their workflow.
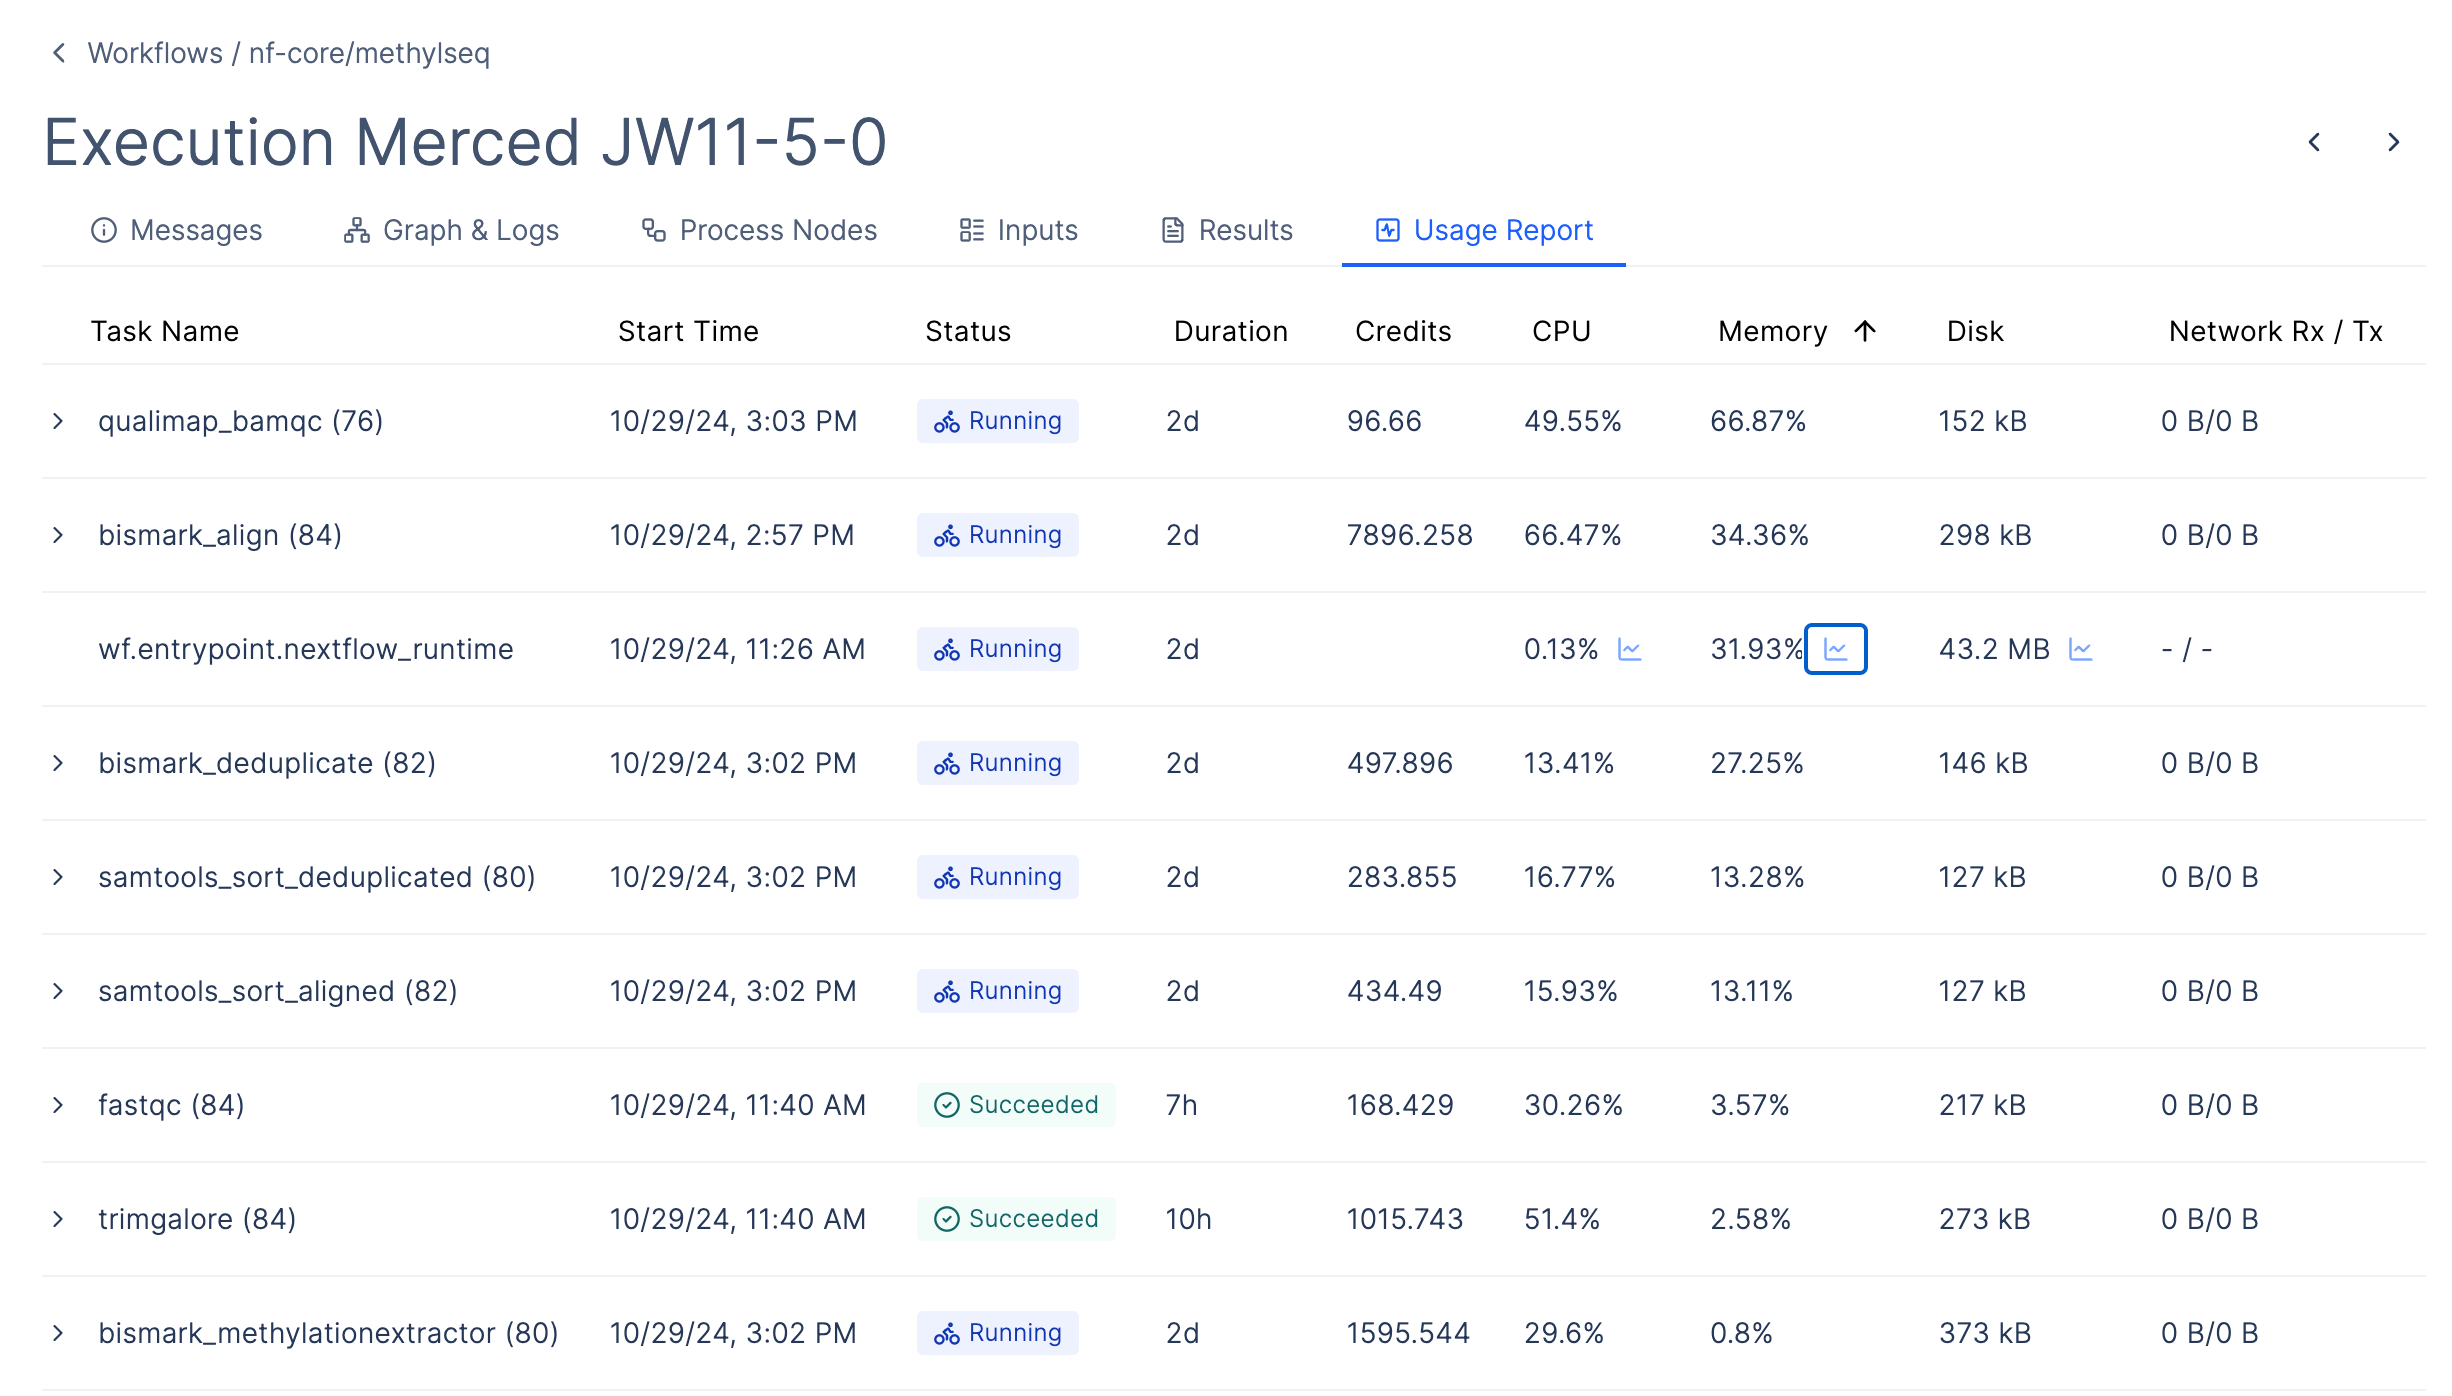
To view the resource usage for a workflow, navigate to the `Usage Report` tab for a workflow execution.
The following is a usage report for a nf-core/methylseq execution.
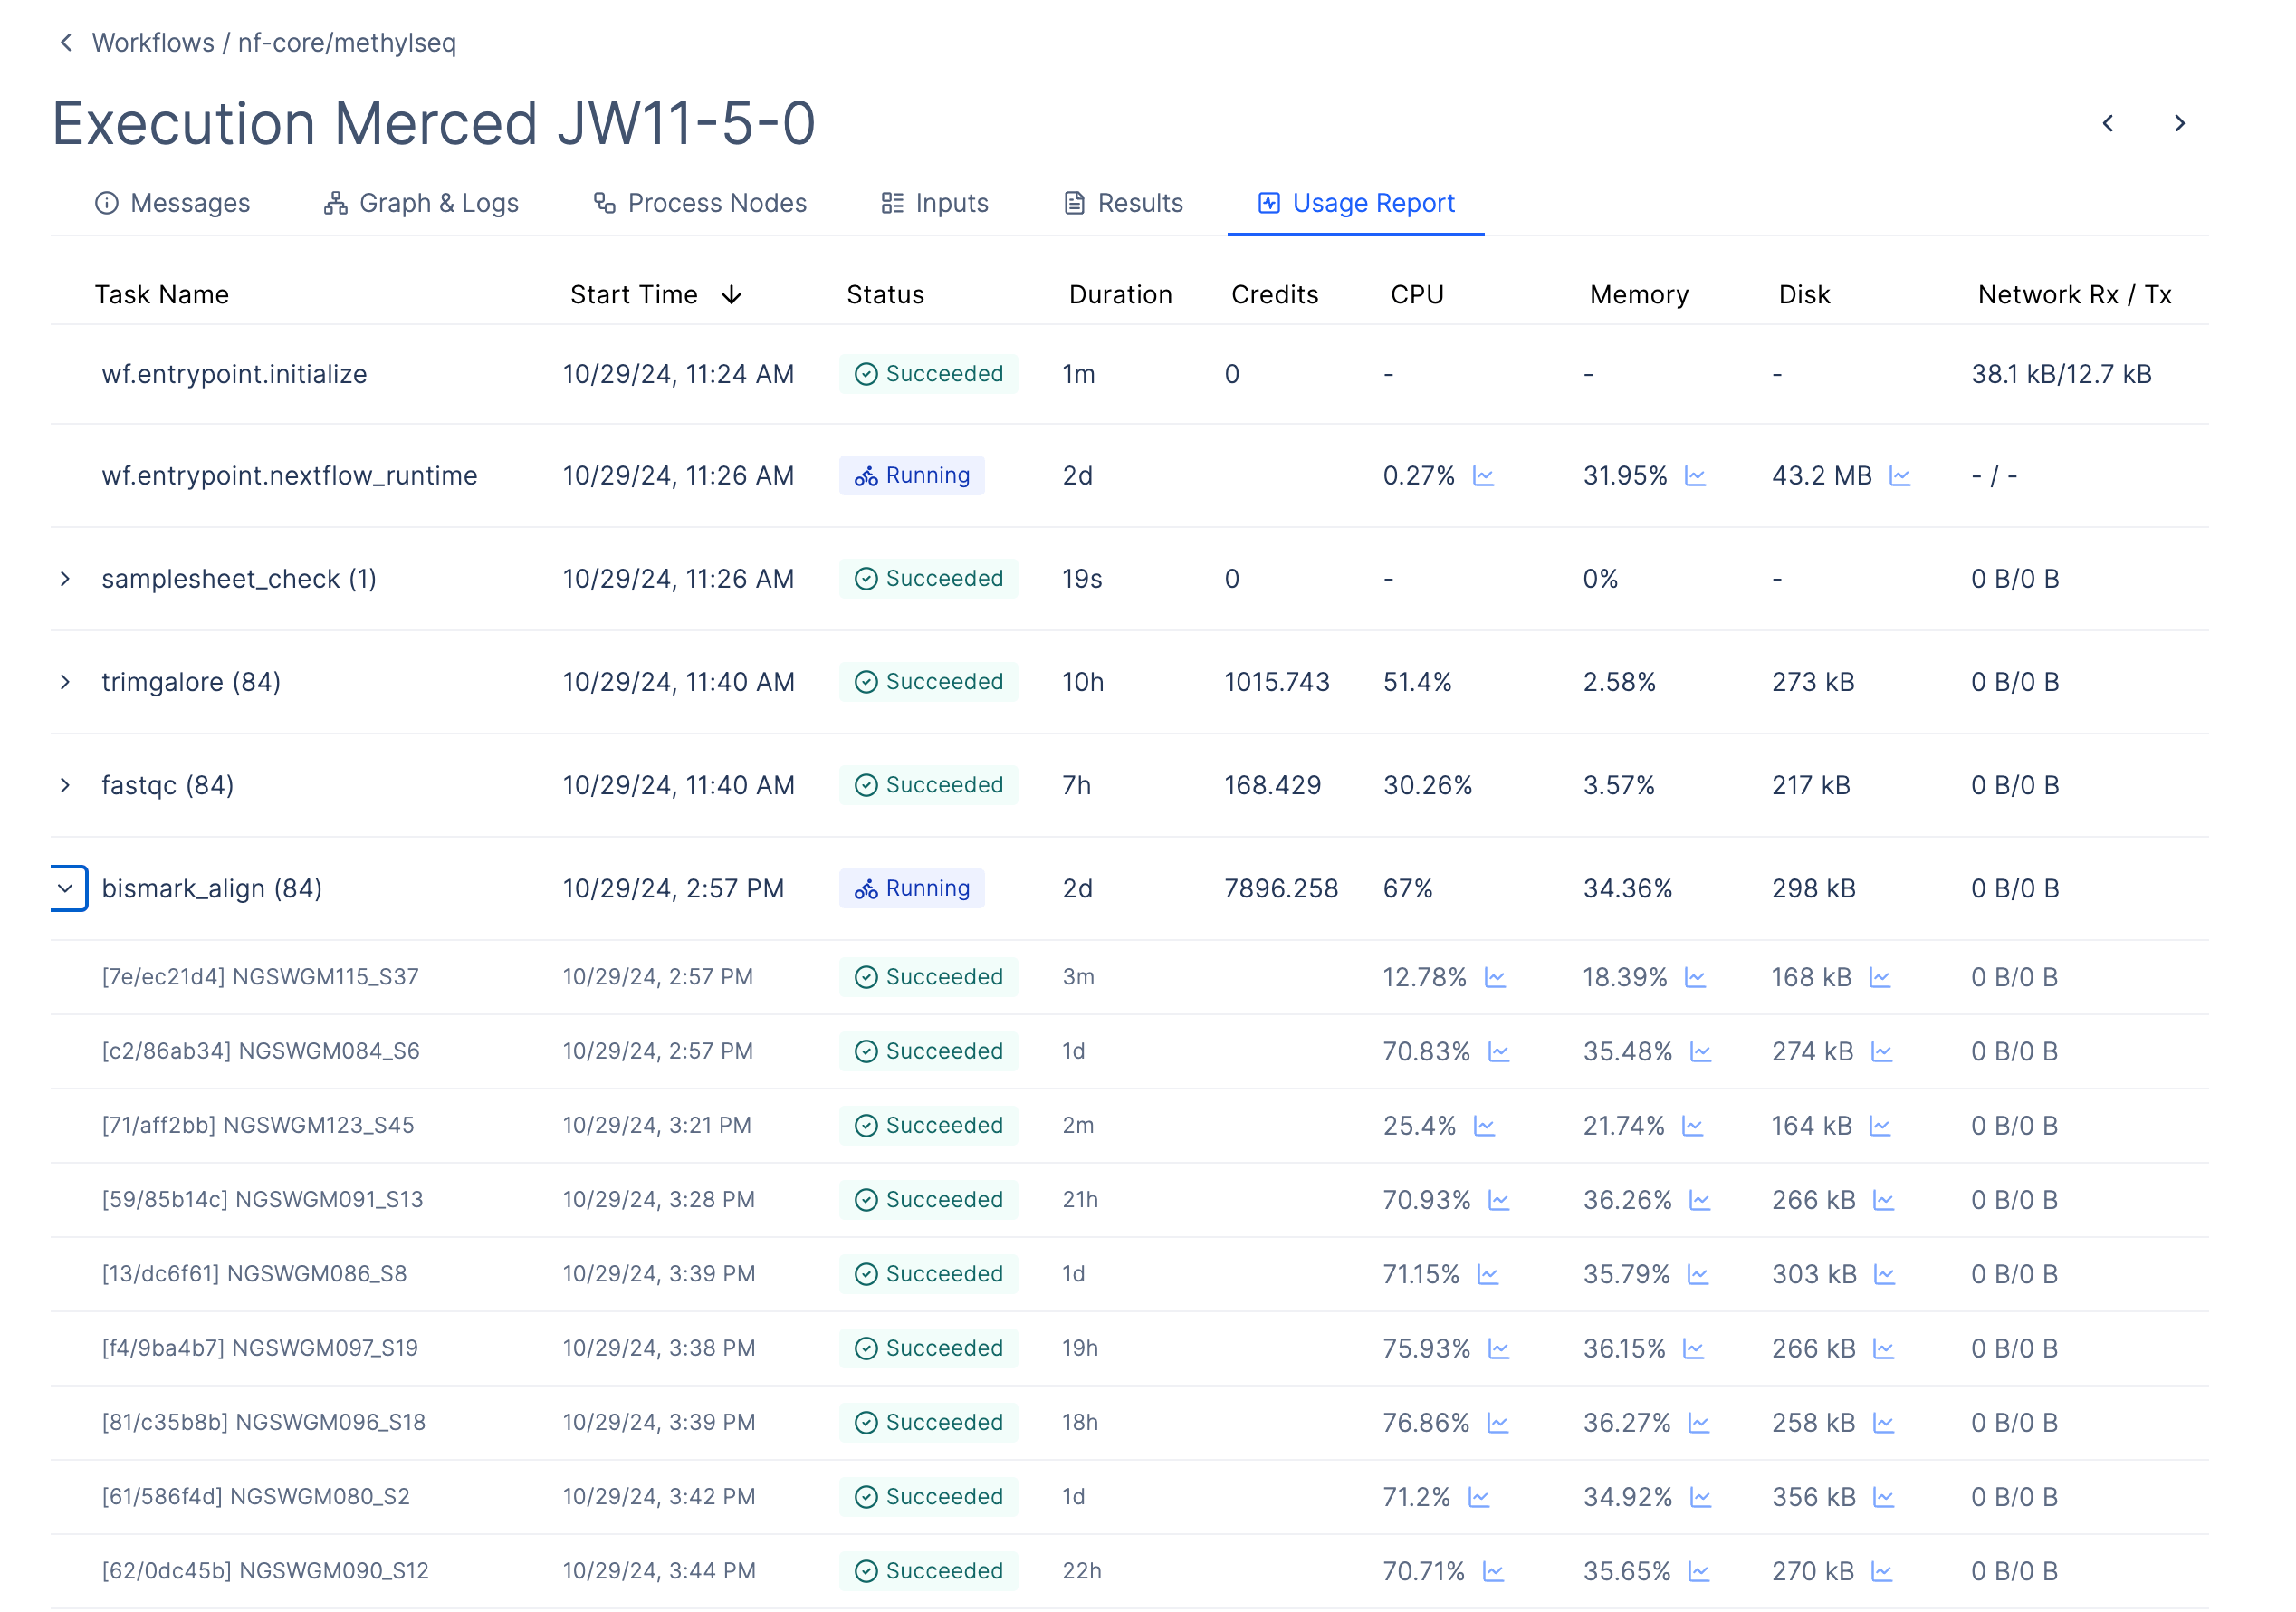 The report collects 5 key metrics for each workflow task:
1. **CPU**: Each data point represents the number of cores used by the task over a time period.
This time period is determined by the operating system and defaults to 100 milliseconds.
For example, a value of 2.0 cores means that the task used 2 cores in the past 100 milliseconds.
*Note: The number of cores used may be temporarily higher than the number of cores allocated.
This can happen if the task is scheduled on a machine with more cores than what was requested by the task.
This is expected behavior.*
2. **Memory**: Number of bytes of memory allocated by the task.
3. **Disk**: Number of bytes of local disk space (EBS) used by the task.
4. **Network Rx**: Bytes received over the network. Only displayed on task completion.
5. **Network Tx:** Bytes transmitted over the network. Only displayed on task completion.
For running tasks, the usage report shows the *latest* usage for each metric.
For completed tasks, it shows the *average* usage.
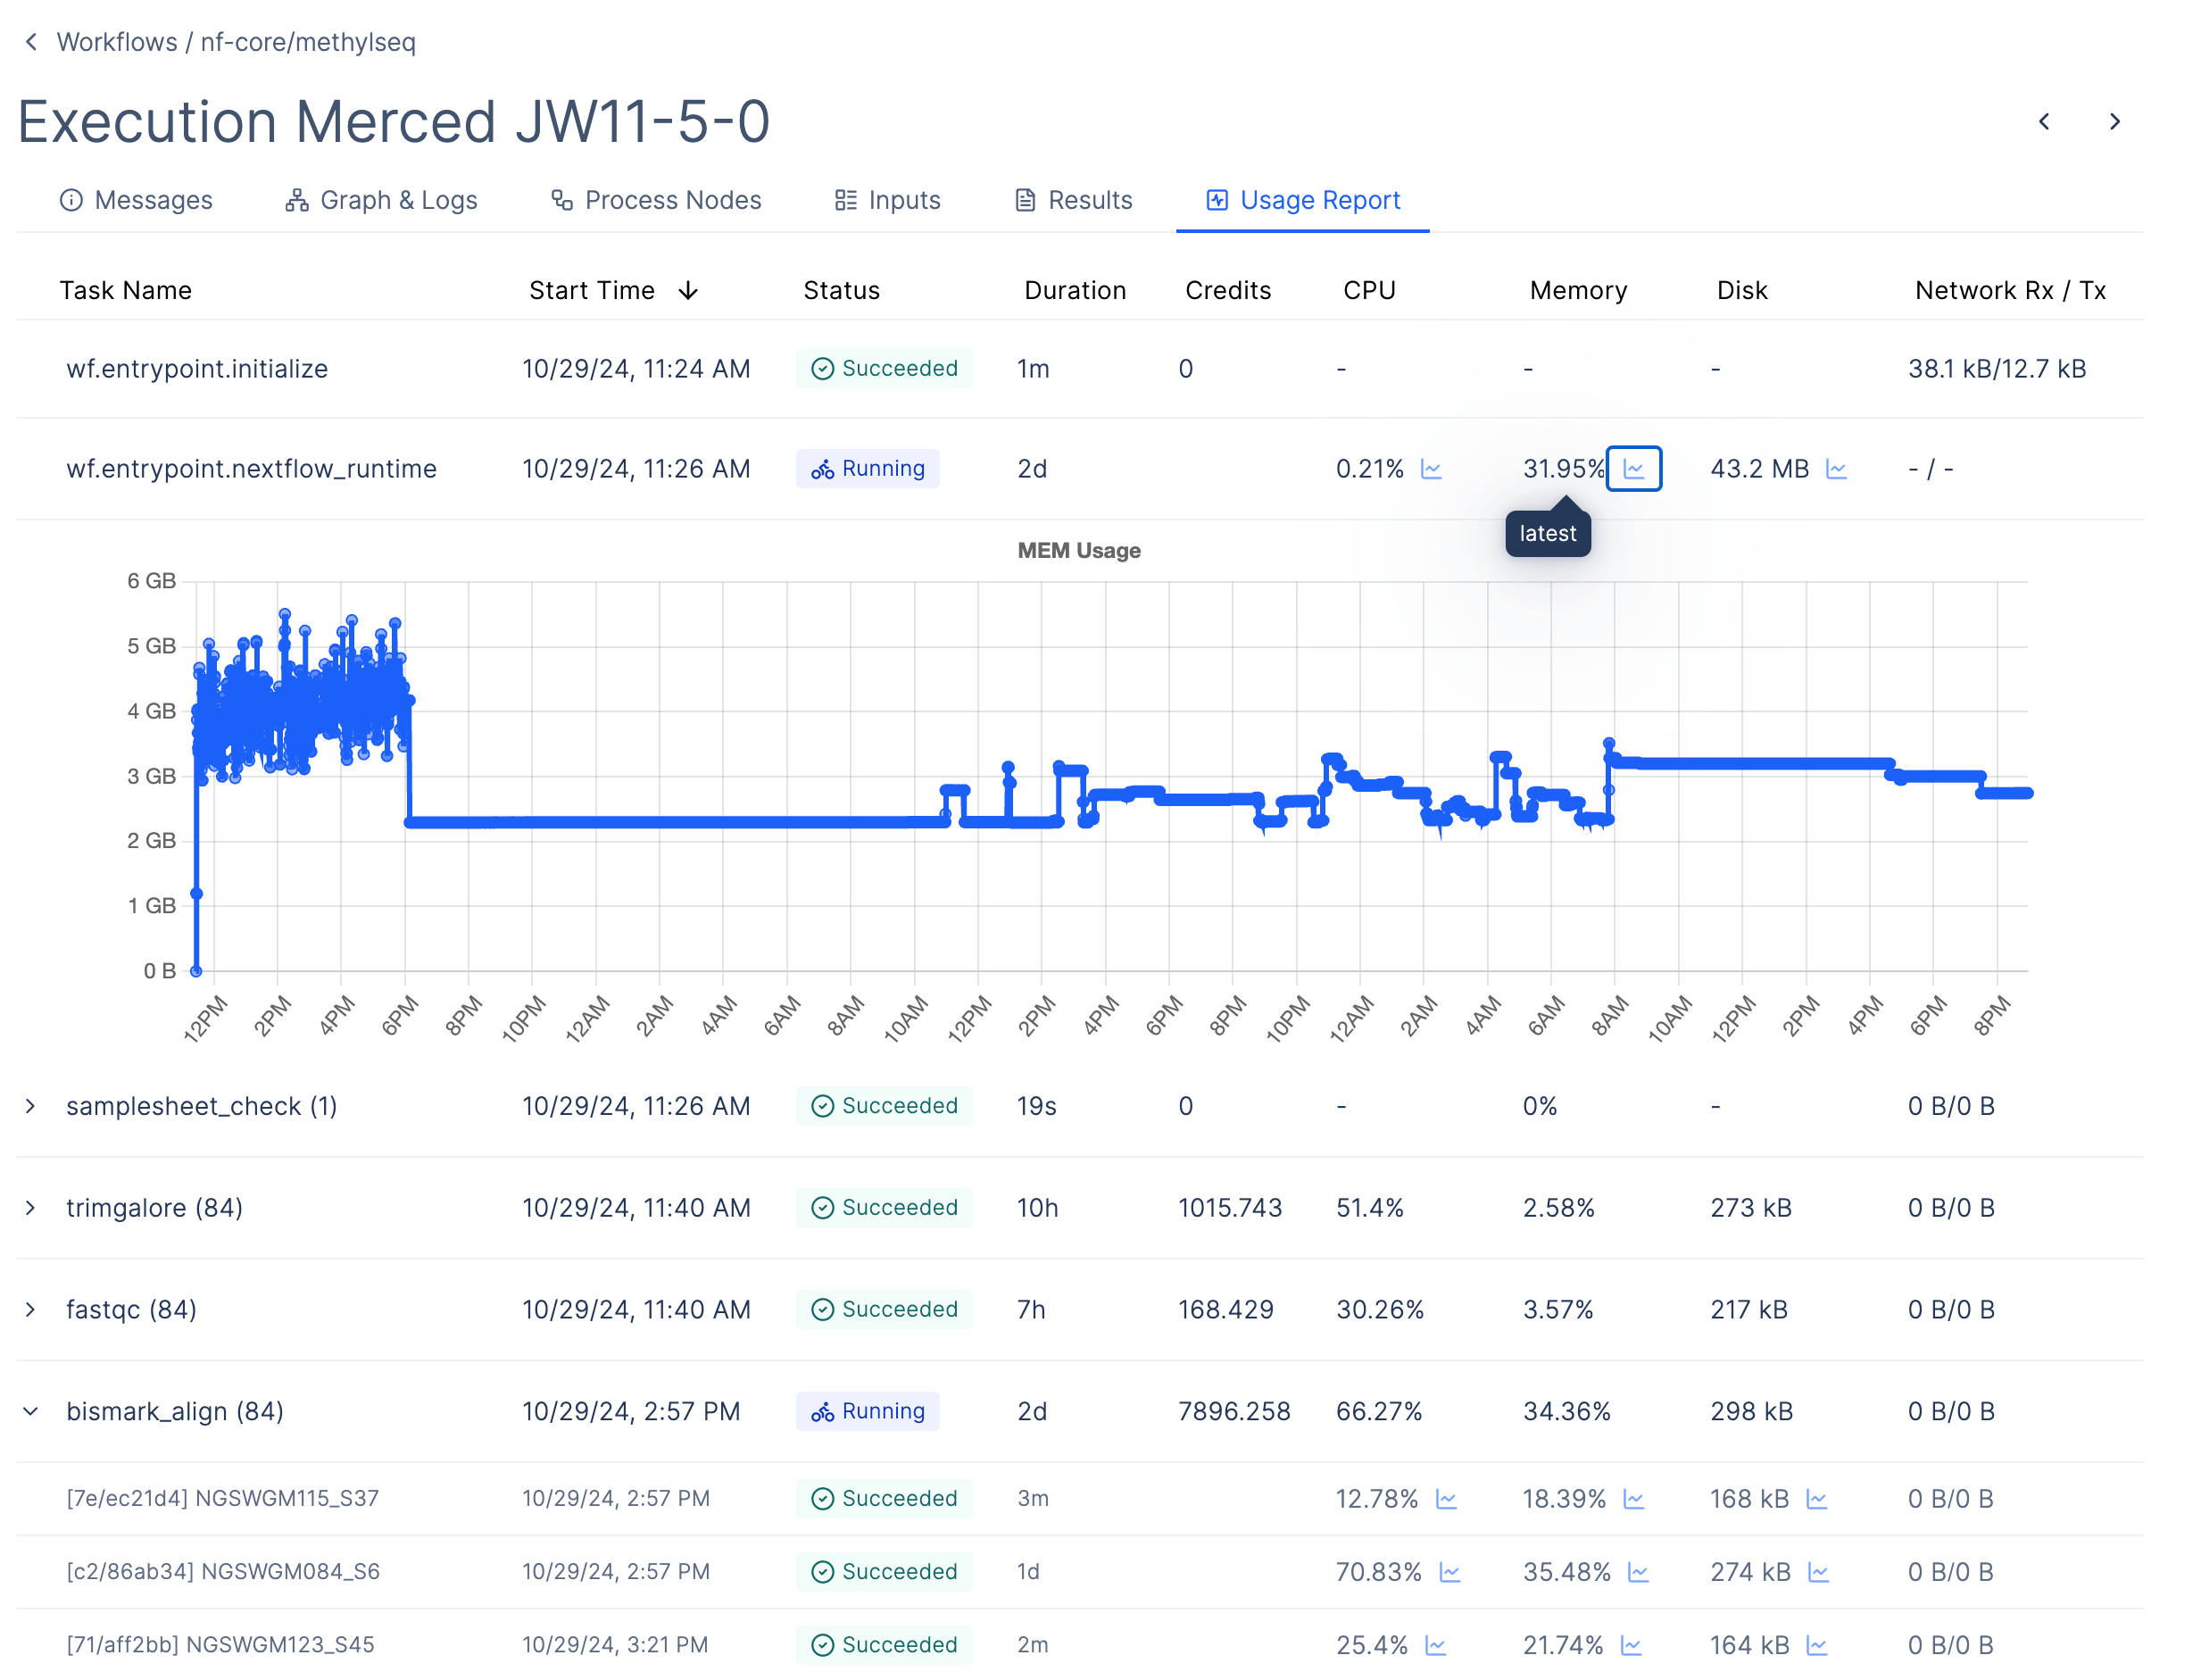
To further investigate usage for a particular task, select the blue icon next to the metric to view
a graph of usage over time.
The report collects 5 key metrics for each workflow task:
1. **CPU**: Each data point represents the number of cores used by the task over a time period.
This time period is determined by the operating system and defaults to 100 milliseconds.
For example, a value of 2.0 cores means that the task used 2 cores in the past 100 milliseconds.
*Note: The number of cores used may be temporarily higher than the number of cores allocated.
This can happen if the task is scheduled on a machine with more cores than what was requested by the task.
This is expected behavior.*
2. **Memory**: Number of bytes of memory allocated by the task.
3. **Disk**: Number of bytes of local disk space (EBS) used by the task.
4. **Network Rx**: Bytes received over the network. Only displayed on task completion.
5. **Network Tx:** Bytes transmitted over the network. Only displayed on task completion.
For running tasks, the usage report shows the *latest* usage for each metric.
For completed tasks, it shows the *average* usage.
To further investigate usage for a particular task, select the blue icon next to the metric to view
a graph of usage over time.
 You can easily navigate to your highest usage tasks by selecting a header to sort the table by.