> ## Documentation Index
> Fetch the complete documentation index at: https://wiki.latch.bio/llms.txt
> Use this file to discover all available pages before exploring further.
# Introduction
> Pollock uses [Scanpy](https://scanpy.readthedocs.io/en/stable/) under the hood to open AnnData files, perform QC (Filtering, normalization), clustering (Leiden, Louvain), Embeddings (PCA, TSNE, UMAP) and finally differential expression analysis (rank_gene_groups)
## General Notes
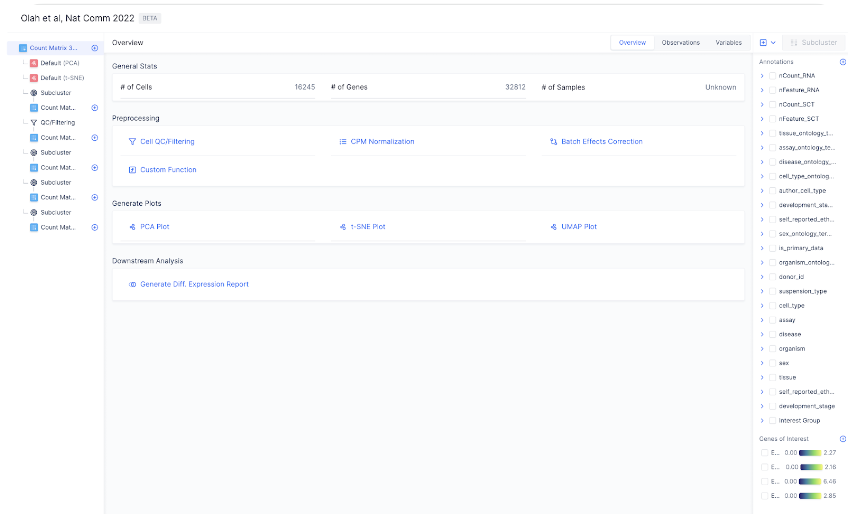 The count matrix view shows general statistics about the loaded AnnData file. The number of cells and genes are computed from the unique indices of `adata.obs` and `adata.var_names` respectively. `# of Samples` are computed from an `adata.obs.samples` column if available in the file.
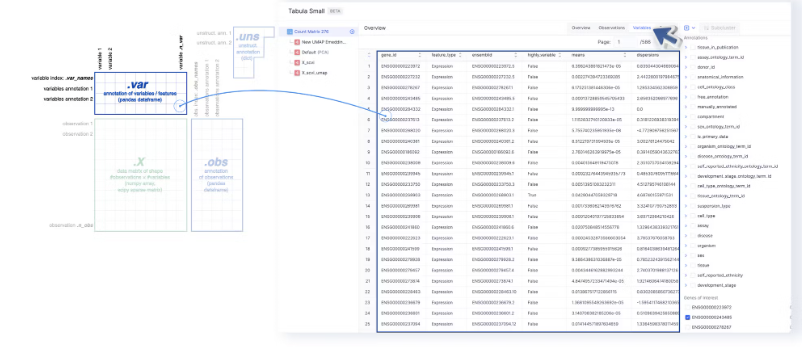
The AnnData file structure can be broken down into these major sections, as explained in details in the original AnnData documentation [here](https://anndata.readthedocs.io/en/latest/):
The count matrix view shows general statistics about the loaded AnnData file. The number of cells and genes are computed from the unique indices of `adata.obs` and `adata.var_names` respectively. `# of Samples` are computed from an `adata.obs.samples` column if available in the file.
The AnnData file structure can be broken down into these major sections, as explained in details in the original AnnData documentation [here](https://anndata.readthedocs.io/en/latest/):
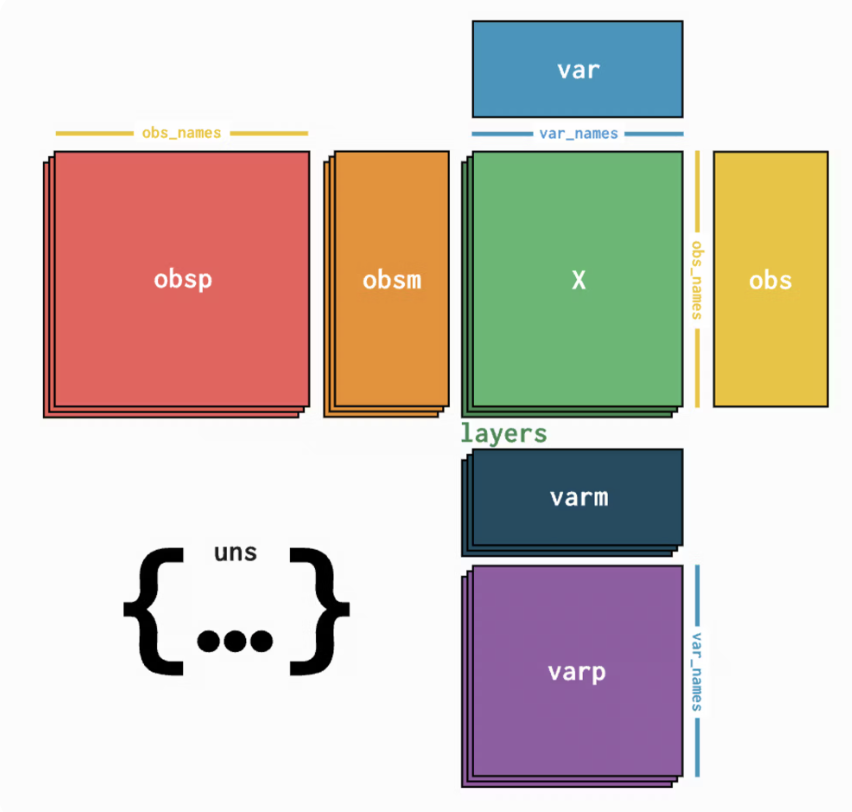 At the moment, the visualizer is not fully up to spec with the AnnData file structure, and only supports direct interactions with a limited number of these sections:
* The **Observations** tab maps to the `adata.obs`, and the annotations on the sidebar are loaded for `adata.obs` as well. Any annotations that are added or edited are also added to `adata.obs`. Cell IDs are also loaded from the index of `adata.obs`.
At the moment, the visualizer is not fully up to spec with the AnnData file structure, and only supports direct interactions with a limited number of these sections:
* The **Observations** tab maps to the `adata.obs`, and the annotations on the sidebar are loaded for `adata.obs` as well. Any annotations that are added or edited are also added to `adata.obs`. Cell IDs are also loaded from the index of `adata.obs`.
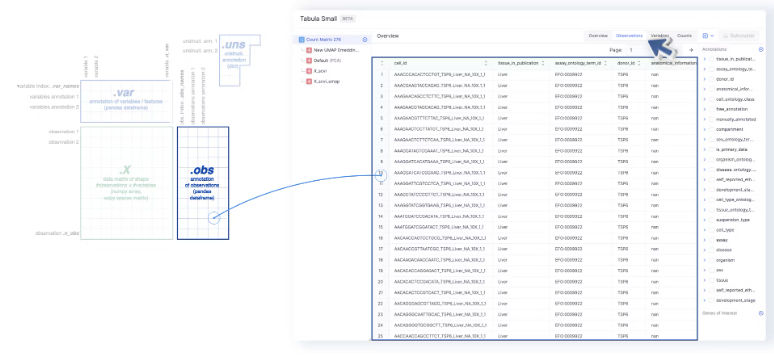
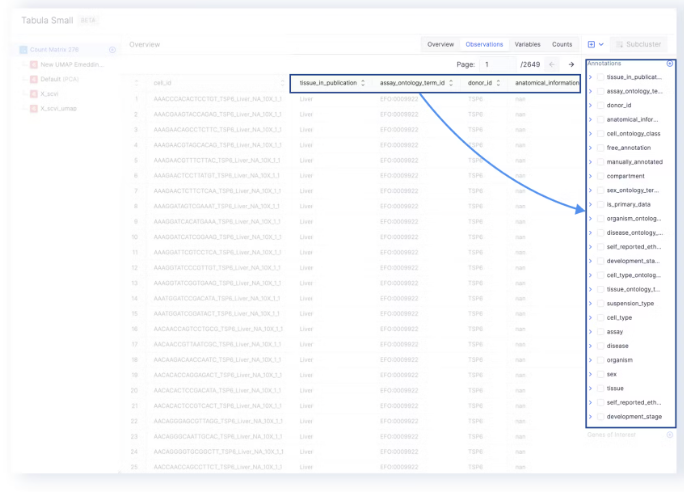 * The annotations on the sidebar can be used to color the UMAP, tSNE, or PCA embeddings.
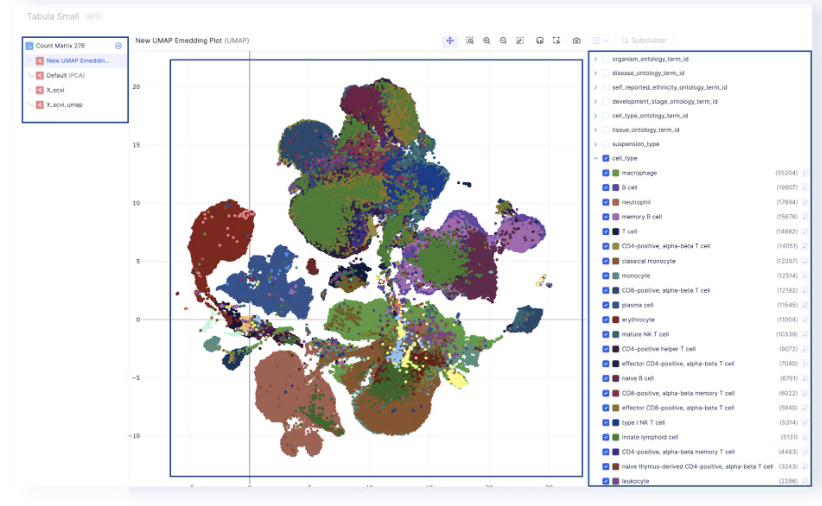 * The **Variables** tab maps to `adata.var` and the index of which (`adata.var_names`) are used as **Gene Names by Genes of Interest and Differential Expression**.
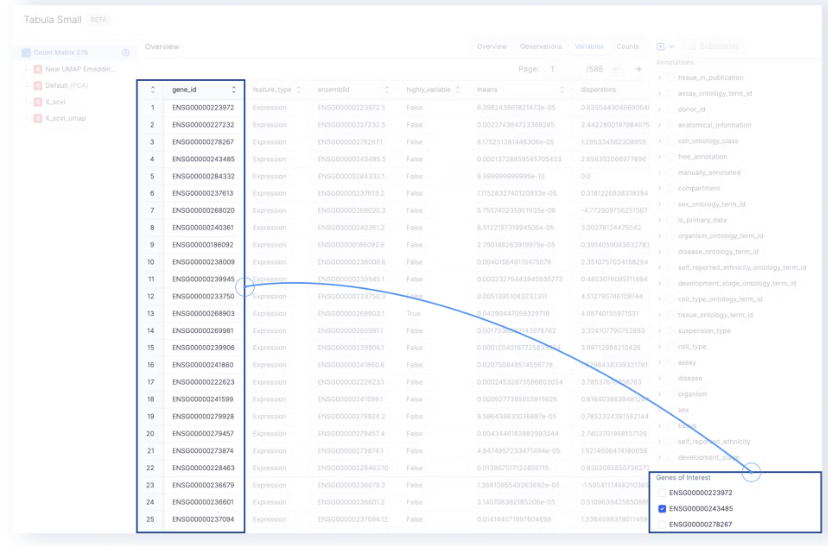
 * The gene names under **Genes of Interest** are extracted from the `gene_id` column of the **Variables** page.
 * The level of gene expression can be highlighted on the embedding by selecting one of the genes of interest.
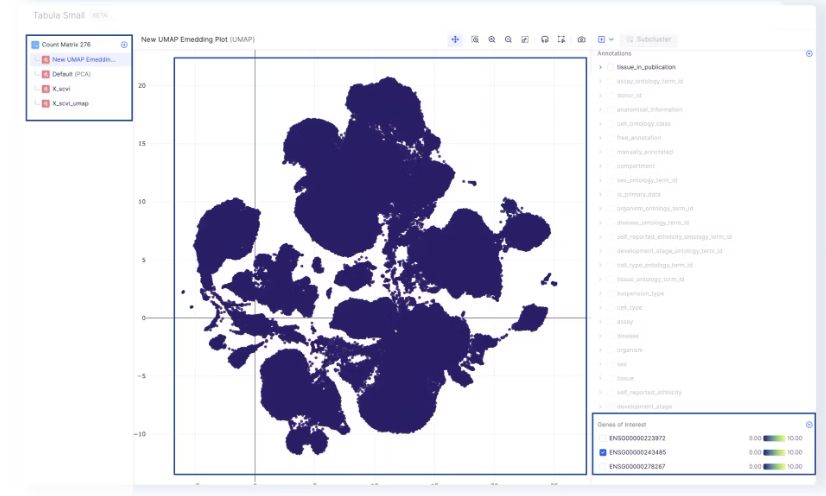 * Embeddings are saved in `adata.obsp` and displayed in the visualizer.
* All mutations are performed directly on the default `.X` matrix in the AnnData file. This was done to be in spec with [Latch’s Single Cell Pipeline](https://console.latch.bio/explore/82115/info). At the moment we do not support editing/replacing layers in the visualizer. Instead, each AnnData file is immutable, any operations that strictly mutates the underlying counts/.X matrix create a new node (.h5ad file)
## Mutations
The Single Cell Visualizer contains a series of mutations that can be run on each AnnData file. The frontend passes the selected parameters to a `scanpy` function on the backend, which subsequently runs the mutation.
An example of how this looks:
* Embeddings are saved in `adata.obsp` and displayed in the visualizer.
* All mutations are performed directly on the default `.X` matrix in the AnnData file. This was done to be in spec with [Latch’s Single Cell Pipeline](https://console.latch.bio/explore/82115/info). At the moment we do not support editing/replacing layers in the visualizer. Instead, each AnnData file is immutable, any operations that strictly mutates the underlying counts/.X matrix create a new node (.h5ad file)
## Mutations
The Single Cell Visualizer contains a series of mutations that can be run on each AnnData file. The frontend passes the selected parameters to a `scanpy` function on the backend, which subsequently runs the mutation.
An example of how this looks:
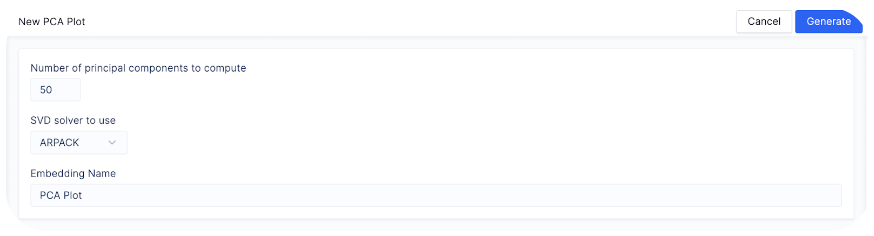 is translated to the backend as:
```
scanpy.tl.pca(n_comps = 50, svd_solver = “arpack”)
```
Here, the two exposed parameters are **Number of PCs to compute** and **SVD solver to use**, which map to the `n_comps`
and `svd_solver` parameters of `scanpy.tl.pca`. Note that if there are no exposed parameters for a mutation on Pollock, default parameters from `scanpy` are used. To see an exhaustive list of default values for `scanpy` functions, visit Scanpy API reference [here](https://scanpy.readthedocs.io/en/stable/api.html).
A list of mutation names on Pollock and underlying Scanpy functions is provided below.
| Mutation Type on Pollock | Mutation Name on Pollock | Underlying Scanpy Function |
| --------------------------------- | ------------------------------ | ----------------------------------------------------------------------------------------------------------------------------------------------------------------------------------------------------------- |
| Cell QC/ Filtering | Counts | [scanpy.pp.filter\_cells](https://scanpy.readthedocs.io/en/stable/generated/scanpy.pp.filter_cells.html) |
| Cell QC/ Filtering | Detected Genes | [scanpy.pp.filter\_genes](https://scanpy.readthedocs.io/en/latest/generated/scanpy.pp.filter_genes.html#scanpy-pp-filter-genes) |
| Cell QC/ Filtering | Mitochondrial Counts | [scanpy.pp.calculate\_qc\_metrics](https://scanpy.readthedocs.io/en/latest/generated/scanpy.pp.calculate_qc_metrics.html#scanpy-pp-calculate-qc-metrics) (for genes detected with prefix MT-) |
| Cell QC/ Filtering | % Ribosomal Counts | [scanpy.pp.calculate\_qc\_metrics](https://scanpy.readthedocs.io/en/latest/generated/scanpy.pp.calculate_qc_metrics.html#scanpy-pp-calculate-qc-metrics) (for genes detected with prefix either RPS or RPL) |
| Normalization | CPM Normalization | [scanpy.pp.normalize\_total](https://scanpy.readthedocs.io/en/latest/generated/scanpy.pp.normalize_total.html#scanpy-pp-normalize-total) |
| Log Transform | Log Transform | [scanpy.pp.log1p](https://scanpy.readthedocs.io/en/latest/generated/scanpy.tl.umap.html#scanpy-tl-umap) |
| Batch Correction | Scanpy | [scanpy.pp.combat](https://scanpy.readthedocs.io/en/latest/generated/scanpy.pp.combat.html#scanpy-pp-combat) |
| Batch Correction | Harmony | [scanpy.external.pp.harmony\_integrate](https://scanpy.readthedocs.io/en/latest/generated/scanpy.external.pp.harmony_integrate.html#scanpy-external-pp-harmony-integrate) |
| PCA (Inplace) | PCA | [scanpy.tl.pca](https://scanpy.readthedocs.io/en/latest/generated/scanpy.tl.pca.html#scanpy-tl-pca) |
| TSNE (Inplace) | TSNE | [scanpy.tl.tsne](https://scanpy.readthedocs.io/en/latest/generated/scanpy.tl.tsne.html#scanpy-tl-tsne) |
| UMAP (Inplace) | UMAP | [scanpy.tl.umap](https://scanpy.readthedocs.io/en/latest/generated/scanpy.tl.umap.html#scanpy-tl-umap) |
| Neighbors (inplace) | Neighbors | [scanpy.pp.neighbors](https://scanpy.readthedocs.io/en/latest/generated/scanpy.tl.rank_genes_groups.html#scanpy-tl-rank-genes-groups) |
| Differential Expression (Inplace) | Differential Expression Report | [scanpy.tl.rank\_genes\_groups](https://scanpy.readthedocs.io/en/latest/generated/scanpy.tl.rank_genes_groups.html#scanpy-tl-rank-genes-groups) |
| Subclustering | Subclustering | AnnData filtering, ex: adata = adata.loc\[adata.obs\[cell\_type] == “t-cell”] |
| Clustering | Leiden | [scanpy.tl.leiden](https://scanpy.readthedocs.io/en/latest/generated/scanpy.tl.leiden.html#scanpy-tl-leiden) |
| Differential Expression (Inplace) | Louvain | [scanpy.tl.louvain](https://scanpy.readthedocs.io/en/latest/generated/scanpy.tl.louvain.html#scanpy-tl-louvain) |
There are a few exceptions to the format above - notably `filter_cells` and `filter_genes` don’t allow for concurrent filtering of cells and genes. In these cases, the functions are run with `min_cells` and `min_genes` respectively before being run again with `max_cells` and `max_genes` respectively based on the range provided via the plot.
is translated to the backend as:
```
scanpy.tl.pca(n_comps = 50, svd_solver = “arpack”)
```
Here, the two exposed parameters are **Number of PCs to compute** and **SVD solver to use**, which map to the `n_comps`
and `svd_solver` parameters of `scanpy.tl.pca`. Note that if there are no exposed parameters for a mutation on Pollock, default parameters from `scanpy` are used. To see an exhaustive list of default values for `scanpy` functions, visit Scanpy API reference [here](https://scanpy.readthedocs.io/en/stable/api.html).
A list of mutation names on Pollock and underlying Scanpy functions is provided below.
| Mutation Type on Pollock | Mutation Name on Pollock | Underlying Scanpy Function |
| --------------------------------- | ------------------------------ | ----------------------------------------------------------------------------------------------------------------------------------------------------------------------------------------------------------- |
| Cell QC/ Filtering | Counts | [scanpy.pp.filter\_cells](https://scanpy.readthedocs.io/en/stable/generated/scanpy.pp.filter_cells.html) |
| Cell QC/ Filtering | Detected Genes | [scanpy.pp.filter\_genes](https://scanpy.readthedocs.io/en/latest/generated/scanpy.pp.filter_genes.html#scanpy-pp-filter-genes) |
| Cell QC/ Filtering | Mitochondrial Counts | [scanpy.pp.calculate\_qc\_metrics](https://scanpy.readthedocs.io/en/latest/generated/scanpy.pp.calculate_qc_metrics.html#scanpy-pp-calculate-qc-metrics) (for genes detected with prefix MT-) |
| Cell QC/ Filtering | % Ribosomal Counts | [scanpy.pp.calculate\_qc\_metrics](https://scanpy.readthedocs.io/en/latest/generated/scanpy.pp.calculate_qc_metrics.html#scanpy-pp-calculate-qc-metrics) (for genes detected with prefix either RPS or RPL) |
| Normalization | CPM Normalization | [scanpy.pp.normalize\_total](https://scanpy.readthedocs.io/en/latest/generated/scanpy.pp.normalize_total.html#scanpy-pp-normalize-total) |
| Log Transform | Log Transform | [scanpy.pp.log1p](https://scanpy.readthedocs.io/en/latest/generated/scanpy.tl.umap.html#scanpy-tl-umap) |
| Batch Correction | Scanpy | [scanpy.pp.combat](https://scanpy.readthedocs.io/en/latest/generated/scanpy.pp.combat.html#scanpy-pp-combat) |
| Batch Correction | Harmony | [scanpy.external.pp.harmony\_integrate](https://scanpy.readthedocs.io/en/latest/generated/scanpy.external.pp.harmony_integrate.html#scanpy-external-pp-harmony-integrate) |
| PCA (Inplace) | PCA | [scanpy.tl.pca](https://scanpy.readthedocs.io/en/latest/generated/scanpy.tl.pca.html#scanpy-tl-pca) |
| TSNE (Inplace) | TSNE | [scanpy.tl.tsne](https://scanpy.readthedocs.io/en/latest/generated/scanpy.tl.tsne.html#scanpy-tl-tsne) |
| UMAP (Inplace) | UMAP | [scanpy.tl.umap](https://scanpy.readthedocs.io/en/latest/generated/scanpy.tl.umap.html#scanpy-tl-umap) |
| Neighbors (inplace) | Neighbors | [scanpy.pp.neighbors](https://scanpy.readthedocs.io/en/latest/generated/scanpy.tl.rank_genes_groups.html#scanpy-tl-rank-genes-groups) |
| Differential Expression (Inplace) | Differential Expression Report | [scanpy.tl.rank\_genes\_groups](https://scanpy.readthedocs.io/en/latest/generated/scanpy.tl.rank_genes_groups.html#scanpy-tl-rank-genes-groups) |
| Subclustering | Subclustering | AnnData filtering, ex: adata = adata.loc\[adata.obs\[cell\_type] == “t-cell”] |
| Clustering | Leiden | [scanpy.tl.leiden](https://scanpy.readthedocs.io/en/latest/generated/scanpy.tl.leiden.html#scanpy-tl-leiden) |
| Differential Expression (Inplace) | Louvain | [scanpy.tl.louvain](https://scanpy.readthedocs.io/en/latest/generated/scanpy.tl.louvain.html#scanpy-tl-louvain) |
There are a few exceptions to the format above - notably `filter_cells` and `filter_genes` don’t allow for concurrent filtering of cells and genes. In these cases, the functions are run with `min_cells` and `min_genes` respectively before being run again with `max_cells` and `max_genes` respectively based on the range provided via the plot.