> ## Documentation Index
> Fetch the complete documentation index at: https://wiki.latch.bio/llms.txt
> Use this file to discover all available pages before exploring further.
# Use Cases
Latch Plots enable scientific teams to get faster and more reproducible results (e.g., standard curves, normalized fluorescence, cell gating) while freeing your bench team’s time from manual qPCR, plate readers, ELISA, and flow cytometry analyses.
Explore the various ways scientists have leveraged Plots for their use cases.
## Downstream of NGS Processing
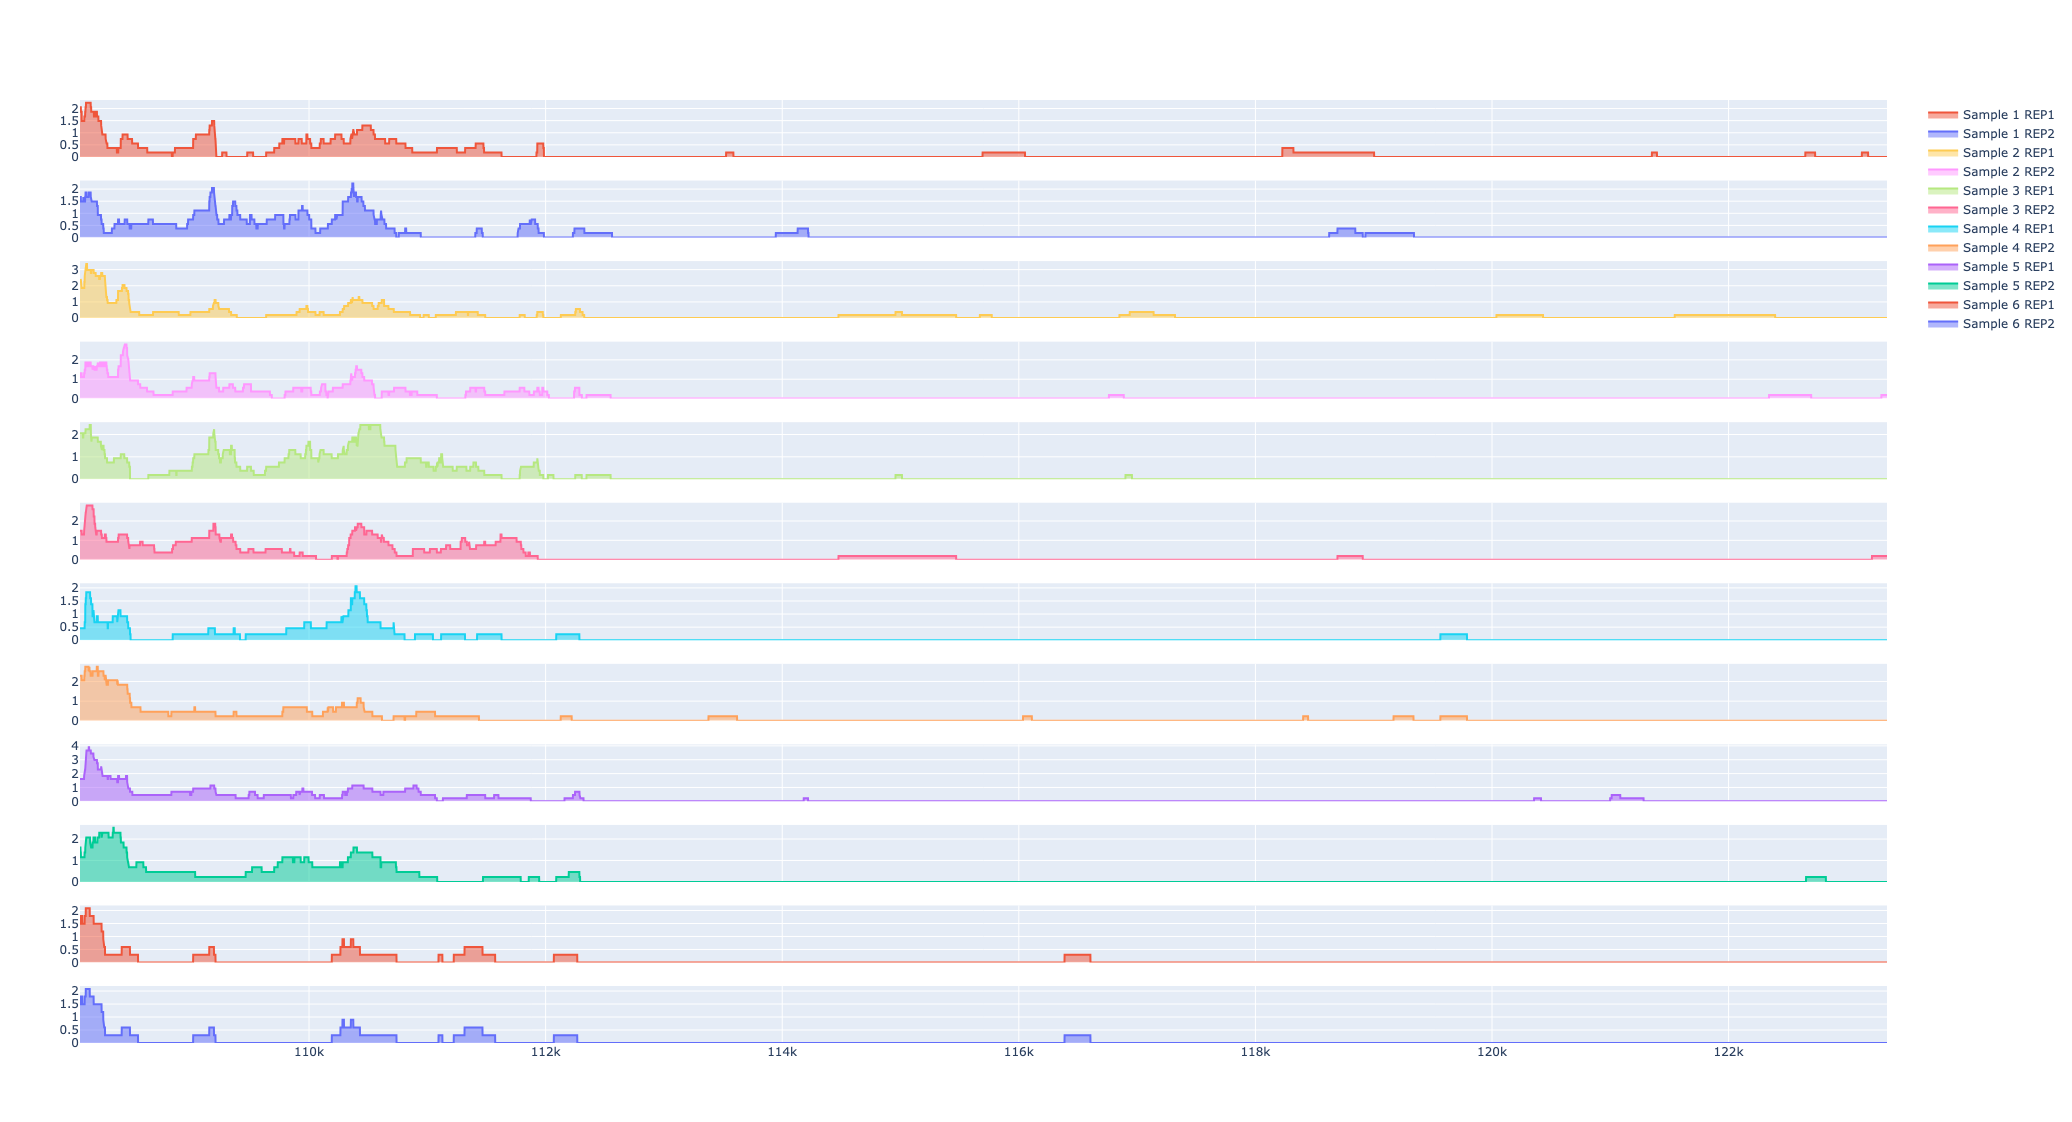 Compare peaks that represent chromatin accessibility across various samples and treatment conditions
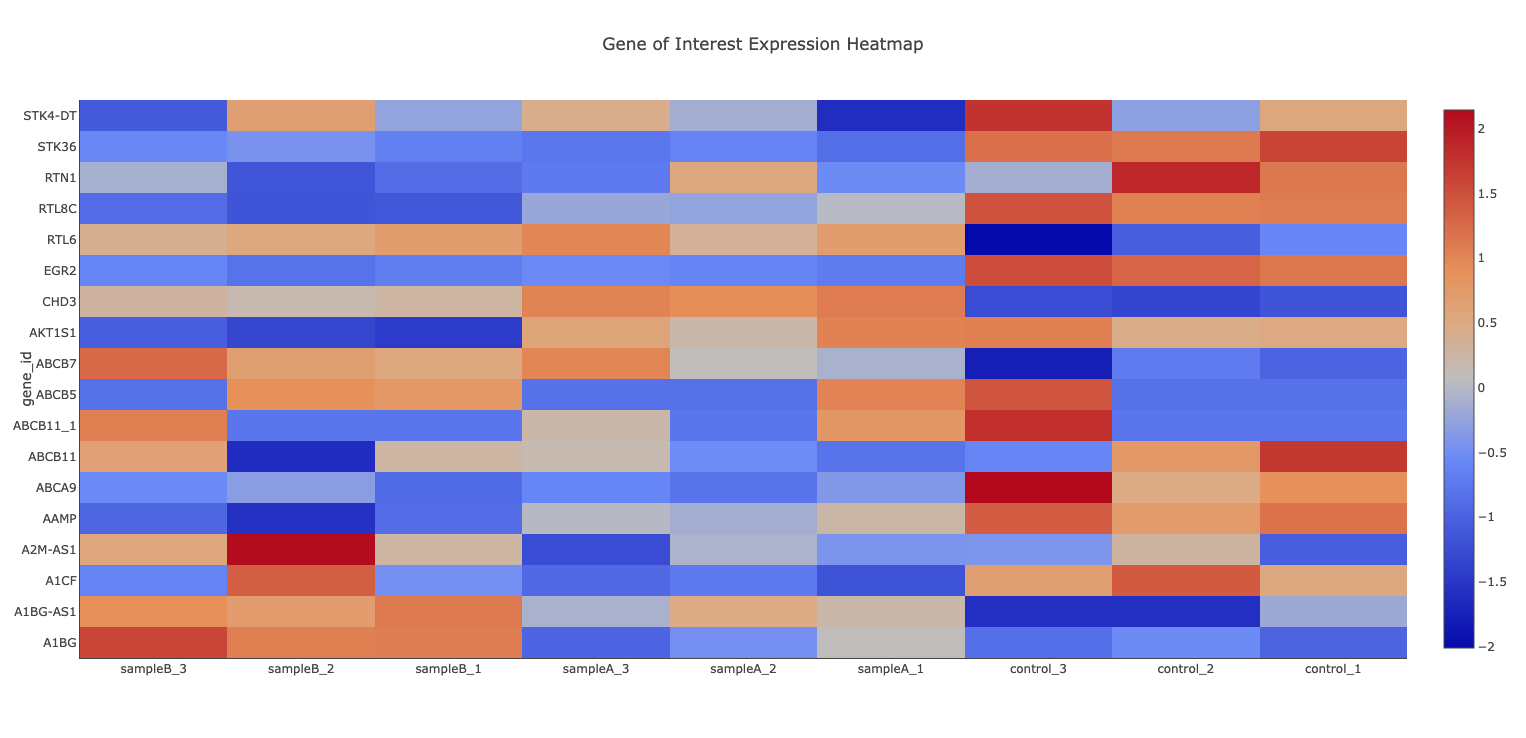 View MA plots, heatmaps, and volcano plots to identify transcriptionally distinct features between biological samples.
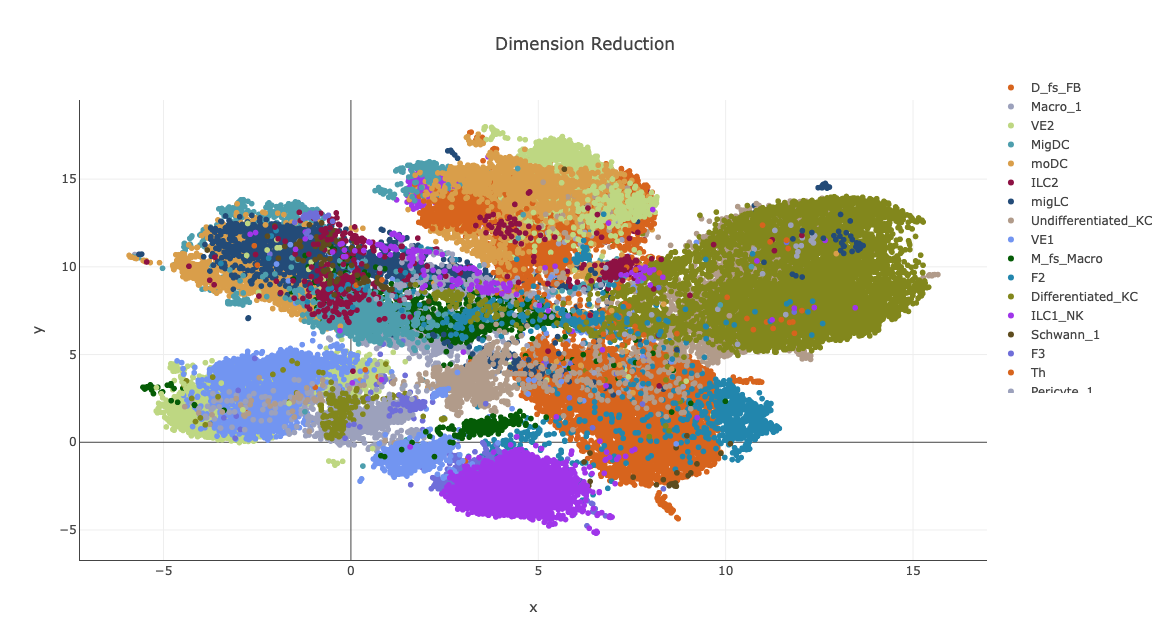 Leverage GPU-enabled visualization dashboard with NVIDIA RAPIDs for fast data pre-processing, clustering, manual and automatic cell type annotation.
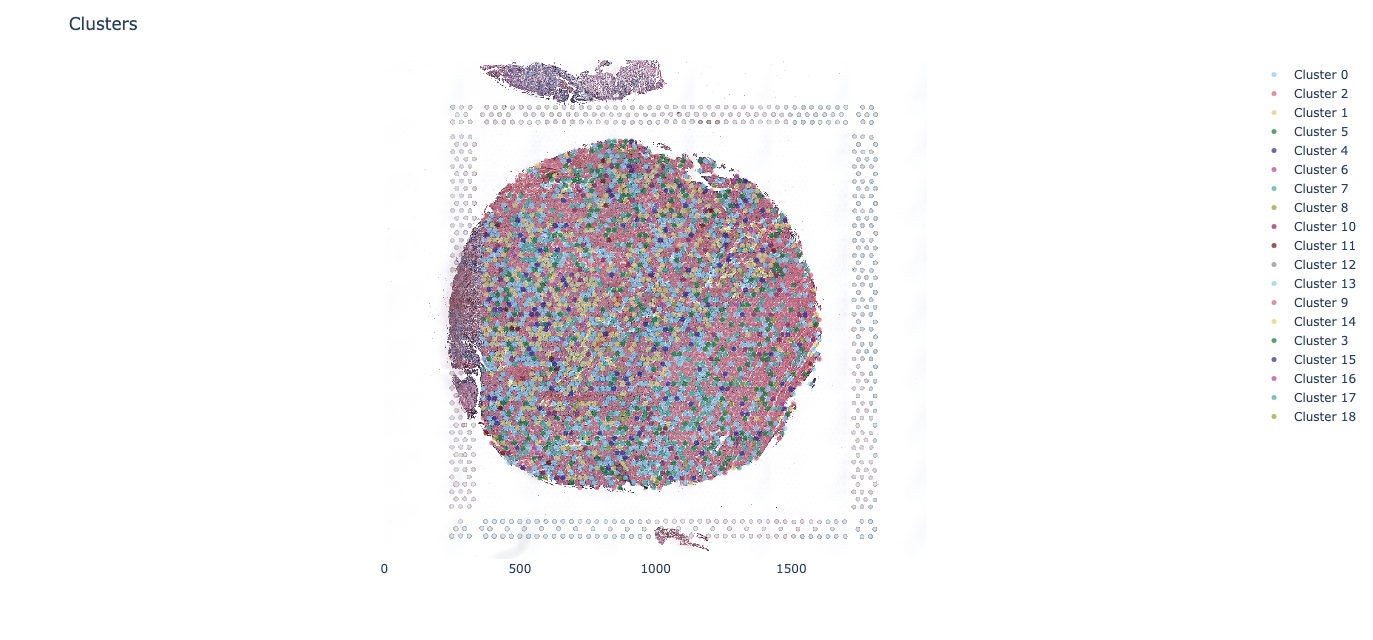 Overlay single-cell gene expression and cell type annotation data over spatial maps generated from Visium HD
## Biochemical Assays
Overlay single-cell gene expression and cell type annotation data over spatial maps generated from Visium HD
## Biochemical Assays
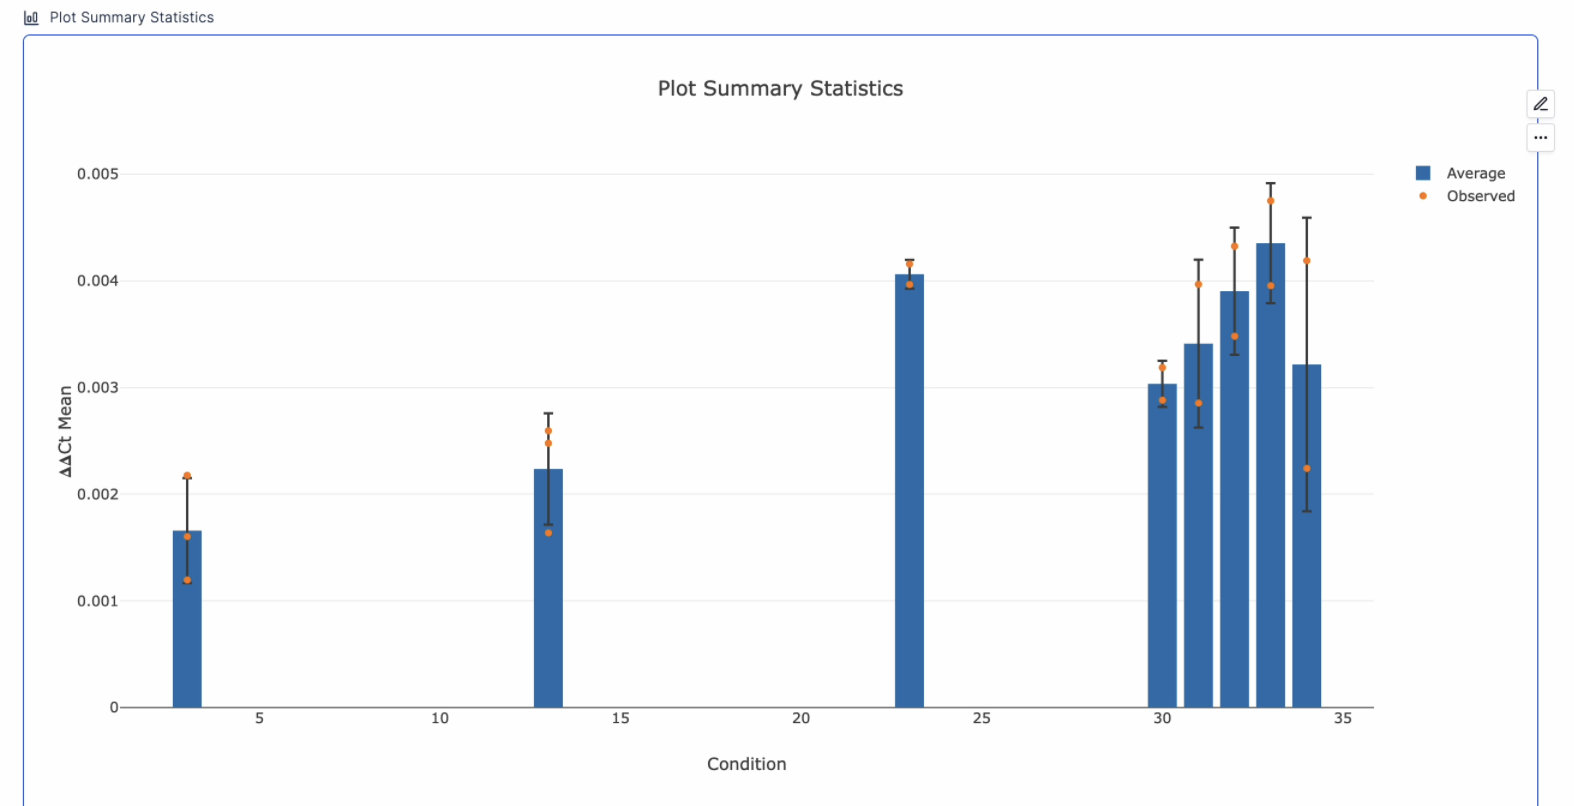 Calculate ∆∆Cqs with a button click, without spreadsheet formulas. Easily modify the aesthetics of generated Plots for publication.
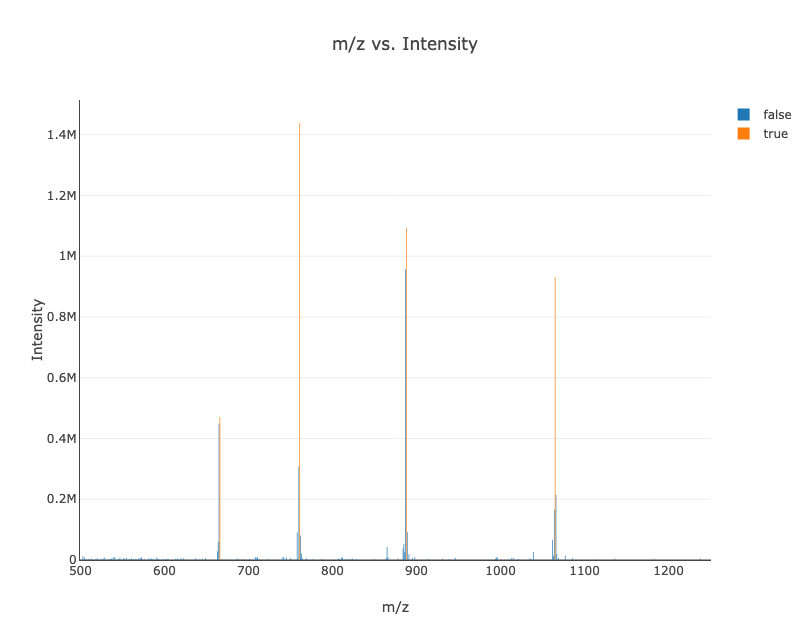 Graph UV absorbance over time alongside intensity versus m/z to provide a full spectrum analysis of LC-MS data.
## Statistical Analyses
Latch Plots also provide out-of-the-box statistical methods that you typically see in GraphPad Prism.
Linear regression
IC50 dose curve fitting
Outlier detection
One-way and two-way ANOVA
t-test
Correlation analysis
Graph UV absorbance over time alongside intensity versus m/z to provide a full spectrum analysis of LC-MS data.
## Statistical Analyses
Latch Plots also provide out-of-the-box statistical methods that you typically see in GraphPad Prism.
Linear regression
IC50 dose curve fitting
Outlier detection
One-way and two-way ANOVA
t-test
Correlation analysis